Japanese vs Afghan Unemployment Among Ages 25 to 29 years
COMPARE
Japanese
Afghan
Unemployment Among Ages 25 to 29 years
Unemployment Among Ages 25 to 29 years Comparison
Japanese
Afghans
6.9%
UNEMPLOYMENT AMONG AGES 25 TO 29 YEARS
5.4/ 100
METRIC RATING
225th/ 347
METRIC RANK
6.4%
UNEMPLOYMENT AMONG AGES 25 TO 29 YEARS
92.5/ 100
METRIC RATING
95th/ 347
METRIC RANK
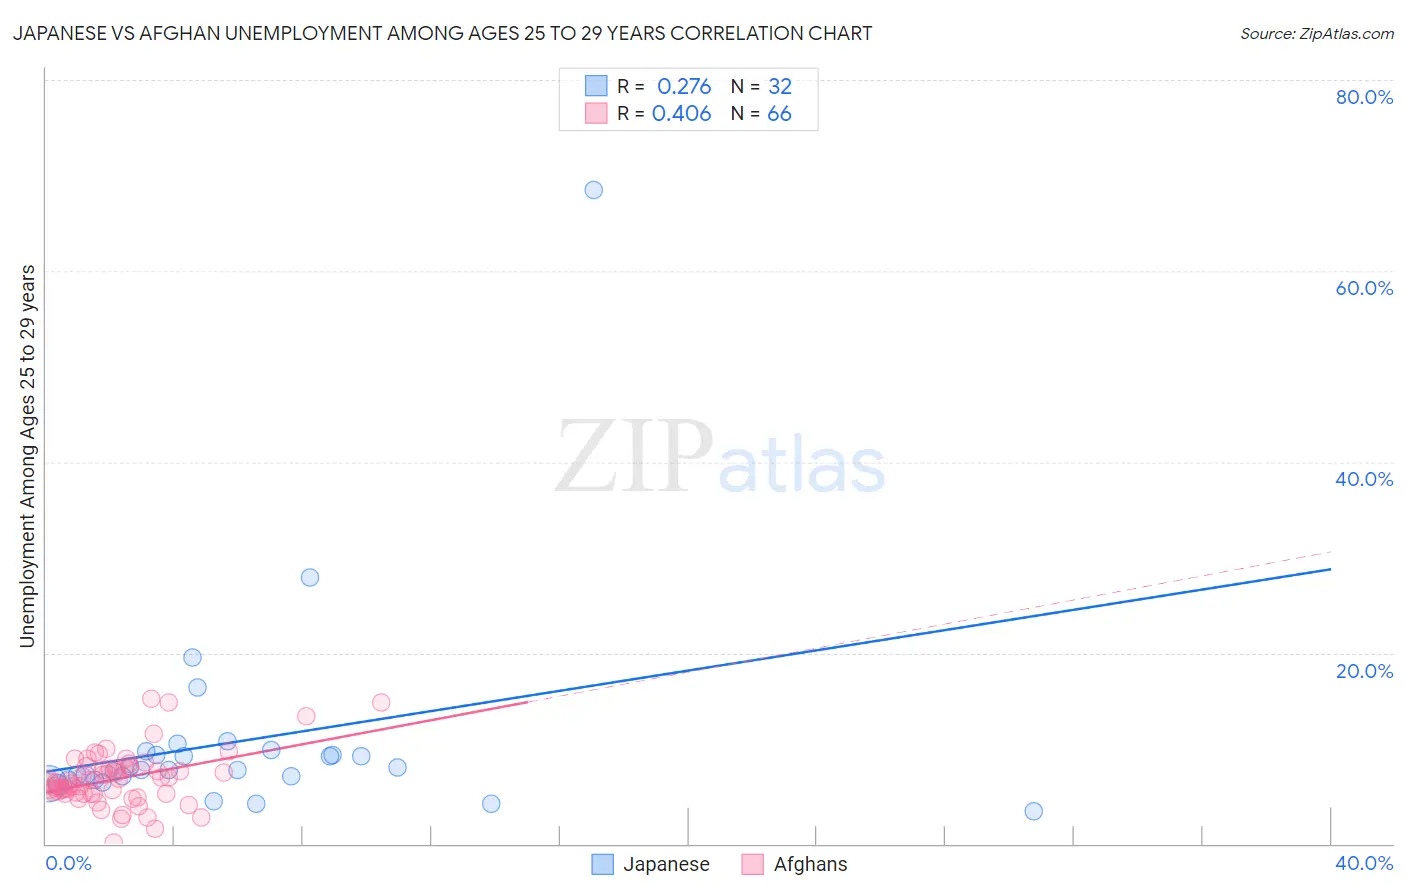
Japanese vs Afghan Unemployment Among Ages 25 to 29 years Correlation Chart
The statistical analysis conducted on geographies consisting of 243,883,894 people shows a weak positive correlation between the proportion of Japanese and unemployment rate among population between the ages 25 and 29 in the United States with a correlation coefficient (R) of 0.276 and weighted average of 6.9%. Similarly, the statistical analysis conducted on geographies consisting of 147,163,258 people shows a moderate positive correlation between the proportion of Afghans and unemployment rate among population between the ages 25 and 29 in the United States with a correlation coefficient (R) of 0.406 and weighted average of 6.4%, a difference of 8.6%.
Unemployment Among Ages 25 to 29 years Correlation Summary
| Measurement | Japanese | Afghan |
| Minimum | 3.4% | 0.10% |
| Maximum | 68.5% | 15.2% |
| Range | 65.1% | 15.1% |
| Mean | 10.7% | 6.8% |
| Median | 7.8% | 6.4% |
| Interquartile 25% (IQ1) | 6.7% | 5.3% |
| Interquartile 75% (IQ3) | 9.5% | 7.9% |
| Interquartile Range (IQR) | 2.9% | 2.7% |
| Standard Deviation (Sample) | 11.5% | 2.9% |
| Standard Deviation (Population) | 11.4% | 2.8% |
Similar Demographics by Unemployment Among Ages 25 to 29 years
Demographics Similar to Japanese by Unemployment Among Ages 25 to 29 years
In terms of unemployment among ages 25 to 29 years, the demographic groups most similar to Japanese are Immigrants from Liberia (7.0%, a difference of 0.19%), Immigrants (6.9%, a difference of 0.22%), Salvadoran (7.0%, a difference of 0.32%), Immigrants from Panama (7.0%, a difference of 0.38%), and Bermudan (7.0%, a difference of 0.53%).
| Demographics | Rating | Rank | Unemployment Among Ages 25 to 29 years |
| Immigrants | Austria | 12.3 /100 | #218 | Poor 6.8% |
| Whites/Caucasians | 10.6 /100 | #219 | Poor 6.9% |
| French | 10.5 /100 | #220 | Poor 6.9% |
| Israelis | 9.8 /100 | #221 | Tragic 6.9% |
| Spaniards | 7.7 /100 | #222 | Tragic 6.9% |
| Celtics | 7.6 /100 | #223 | Tragic 6.9% |
| Immigrants | Immigrants | 6.2 /100 | #224 | Tragic 6.9% |
| Japanese | 5.4 /100 | #225 | Tragic 6.9% |
| Immigrants | Liberia | 4.8 /100 | #226 | Tragic 7.0% |
| Salvadorans | 4.4 /100 | #227 | Tragic 7.0% |
| Immigrants | Panama | 4.2 /100 | #228 | Tragic 7.0% |
| Bermudans | 3.8 /100 | #229 | Tragic 7.0% |
| Immigrants | El Salvador | 3.6 /100 | #230 | Tragic 7.0% |
| Central Americans | 3.0 /100 | #231 | Tragic 7.0% |
| Spanish Americans | 2.7 /100 | #232 | Tragic 7.0% |
Demographics Similar to Afghans by Unemployment Among Ages 25 to 29 years
In terms of unemployment among ages 25 to 29 years, the demographic groups most similar to Afghans are Immigrants from Brazil (6.4%, a difference of 0.080%), Immigrants from Eastern Europe (6.4%, a difference of 0.14%), Serbian (6.4%, a difference of 0.17%), Zimbabwean (6.4%, a difference of 0.24%), and Iraqi (6.4%, a difference of 0.25%).
| Demographics | Rating | Rank | Unemployment Among Ages 25 to 29 years |
| Immigrants | Indonesia | 94.5 /100 | #88 | Exceptional 6.4% |
| Immigrants | Oceania | 94.1 /100 | #89 | Exceptional 6.4% |
| Lebanese | 93.9 /100 | #90 | Exceptional 6.4% |
| Egyptians | 93.9 /100 | #91 | Exceptional 6.4% |
| Immigrants | North Macedonia | 93.6 /100 | #92 | Exceptional 6.4% |
| Australians | 93.6 /100 | #93 | Exceptional 6.4% |
| Zimbabweans | 93.5 /100 | #94 | Exceptional 6.4% |
| Afghans | 92.5 /100 | #95 | Exceptional 6.4% |
| Immigrants | Brazil | 92.1 /100 | #96 | Exceptional 6.4% |
| Immigrants | Eastern Europe | 91.9 /100 | #97 | Exceptional 6.4% |
| Serbians | 91.7 /100 | #98 | Exceptional 6.4% |
| Iraqis | 91.3 /100 | #99 | Exceptional 6.4% |
| Uruguayans | 91.2 /100 | #100 | Exceptional 6.4% |
| Immigrants | Ireland | 91.1 /100 | #101 | Exceptional 6.4% |
| British | 90.5 /100 | #102 | Exceptional 6.4% |