Japanese vs Immigrants from South America Unemployment Among Women with Children Under 6 years
COMPARE
Japanese
Immigrants from South America
Unemployment Among Women with Children Under 6 years
Unemployment Among Women with Children Under 6 years Comparison
Japanese
Immigrants from South America
7.5%
UNEMPLOYMENT AMONG WOMEN WITH CHILDREN UNDER 6 YEARS
78.9/ 100
METRIC RATING
146th/ 347
METRIC RANK
7.6%
UNEMPLOYMENT AMONG WOMEN WITH CHILDREN UNDER 6 YEARS
65.6/ 100
METRIC RATING
165th/ 347
METRIC RANK
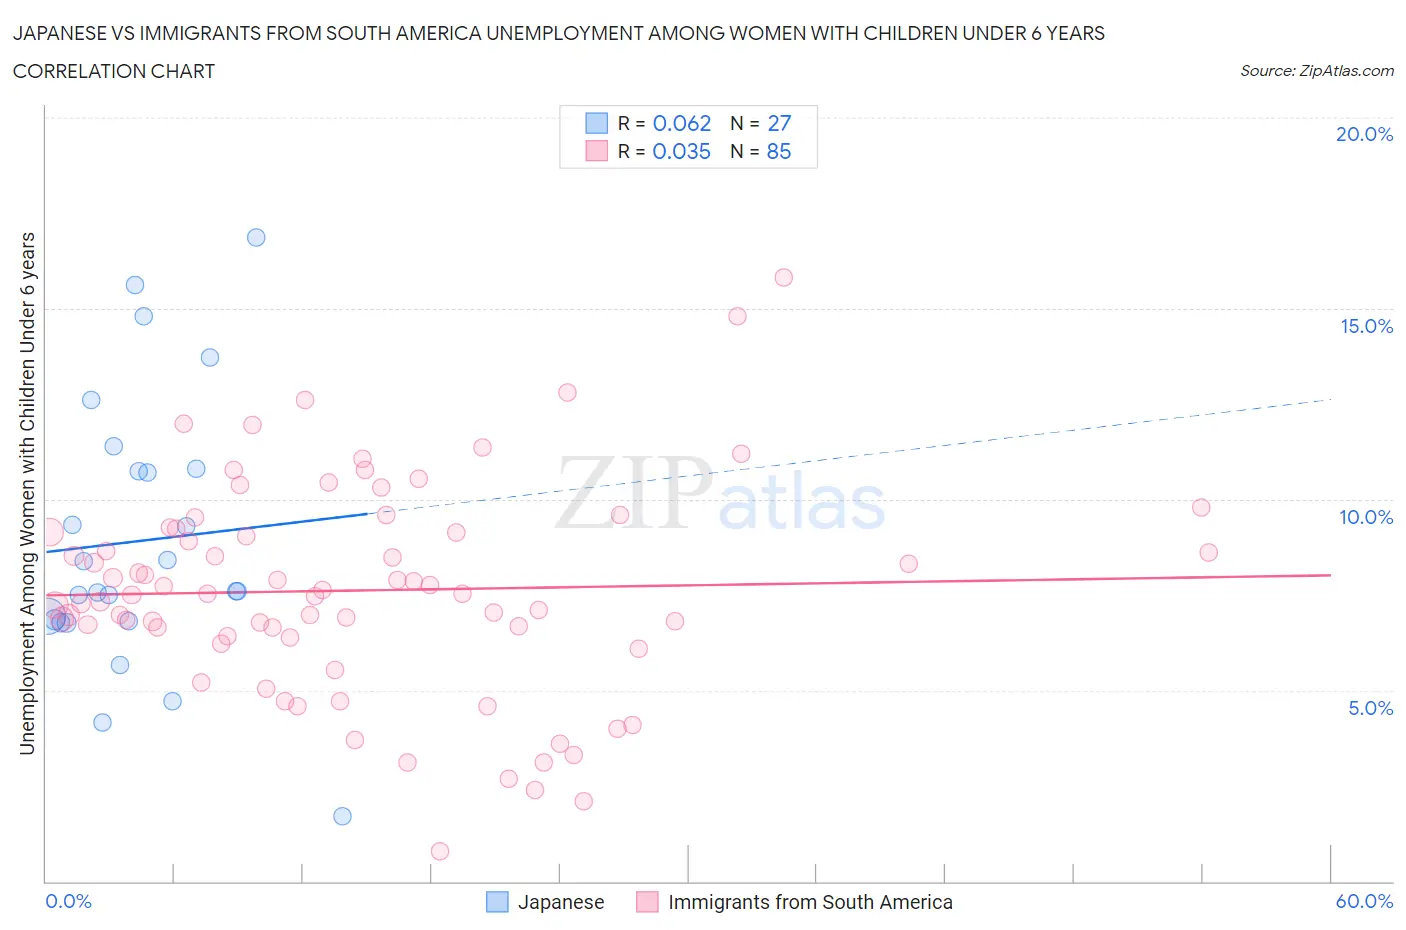
Japanese vs Immigrants from South America Unemployment Among Women with Children Under 6 years Correlation Chart
The statistical analysis conducted on geographies consisting of 210,271,633 people shows a slight positive correlation between the proportion of Japanese and unemployment rate among women with children under the age of 6 in the United States with a correlation coefficient (R) of 0.062 and weighted average of 7.5%. Similarly, the statistical analysis conducted on geographies consisting of 350,771,167 people shows no correlation between the proportion of Immigrants from South America and unemployment rate among women with children under the age of 6 in the United States with a correlation coefficient (R) of 0.035 and weighted average of 7.6%, a difference of 1.1%.
Unemployment Among Women with Children Under 6 years Correlation Summary
| Measurement | Japanese | Immigrants from South America |
| Minimum | 1.7% | 0.80% |
| Maximum | 16.9% | 15.8% |
| Range | 15.2% | 15.0% |
| Mean | 8.9% | 7.6% |
| Median | 7.6% | 7.5% |
| Interquartile 25% (IQ1) | 6.8% | 6.4% |
| Interquartile 75% (IQ3) | 10.8% | 9.2% |
| Interquartile Range (IQR) | 4.0% | 2.8% |
| Standard Deviation (Sample) | 3.6% | 2.8% |
| Standard Deviation (Population) | 3.5% | 2.8% |
Demographics Similar to Japanese and Immigrants from South America by Unemployment Among Women with Children Under 6 years
In terms of unemployment among women with children under 6 years, the demographic groups most similar to Japanese are Immigrants from Jordan (7.5%, a difference of 0.0%), Immigrants from Oceania (7.5%, a difference of 0.050%), Immigrants from Brazil (7.5%, a difference of 0.16%), Colombian (7.5%, a difference of 0.27%), and Aleut (7.5%, a difference of 0.28%). Similarly, the demographic groups most similar to Immigrants from South America are Ugandan (7.6%, a difference of 0.020%), British (7.6%, a difference of 0.050%), Immigrants from Lithuania (7.5%, a difference of 0.24%), Immigrants from Western Asia (7.5%, a difference of 0.36%), and Bolivian (7.5%, a difference of 0.40%).
| Demographics | Rating | Rank | Unemployment Among Women with Children Under 6 years |
| Immigrants | Jordan | 78.9 /100 | #145 | Good 7.5% |
| Japanese | 78.9 /100 | #146 | Good 7.5% |
| Immigrants | Oceania | 78.4 /100 | #147 | Good 7.5% |
| Immigrants | Brazil | 77.3 /100 | #148 | Good 7.5% |
| Colombians | 76.1 /100 | #149 | Good 7.5% |
| Aleuts | 76.0 /100 | #150 | Good 7.5% |
| Immigrants | Peru | 74.9 /100 | #151 | Good 7.5% |
| Bangladeshis | 74.8 /100 | #152 | Good 7.5% |
| Uruguayans | 74.7 /100 | #153 | Good 7.5% |
| Northern Europeans | 74.3 /100 | #154 | Good 7.5% |
| South Americans | 74.1 /100 | #155 | Good 7.5% |
| Immigrants | Southern Europe | 73.2 /100 | #156 | Good 7.5% |
| Peruvians | 72.3 /100 | #157 | Good 7.5% |
| Croatians | 71.9 /100 | #158 | Good 7.5% |
| Immigrants | Philippines | 71.3 /100 | #159 | Good 7.5% |
| Bolivians | 70.8 /100 | #160 | Good 7.5% |
| Immigrants | Western Asia | 70.2 /100 | #161 | Good 7.5% |
| Immigrants | Lithuania | 68.8 /100 | #162 | Good 7.5% |
| British | 66.3 /100 | #163 | Good 7.6% |
| Ugandans | 65.8 /100 | #164 | Good 7.6% |
| Immigrants | South America | 65.6 /100 | #165 | Good 7.6% |