Immigrants from Nepal vs Afghan Unemployment Among Ages 25 to 29 years
COMPARE
Immigrants from Nepal
Afghan
Unemployment Among Ages 25 to 29 years
Unemployment Among Ages 25 to 29 years Comparison
Immigrants from Nepal
Afghans
5.7%
UNEMPLOYMENT AMONG AGES 25 TO 29 YEARS
100.0/ 100
METRIC RATING
9th/ 347
METRIC RANK
6.4%
UNEMPLOYMENT AMONG AGES 25 TO 29 YEARS
92.5/ 100
METRIC RATING
95th/ 347
METRIC RANK
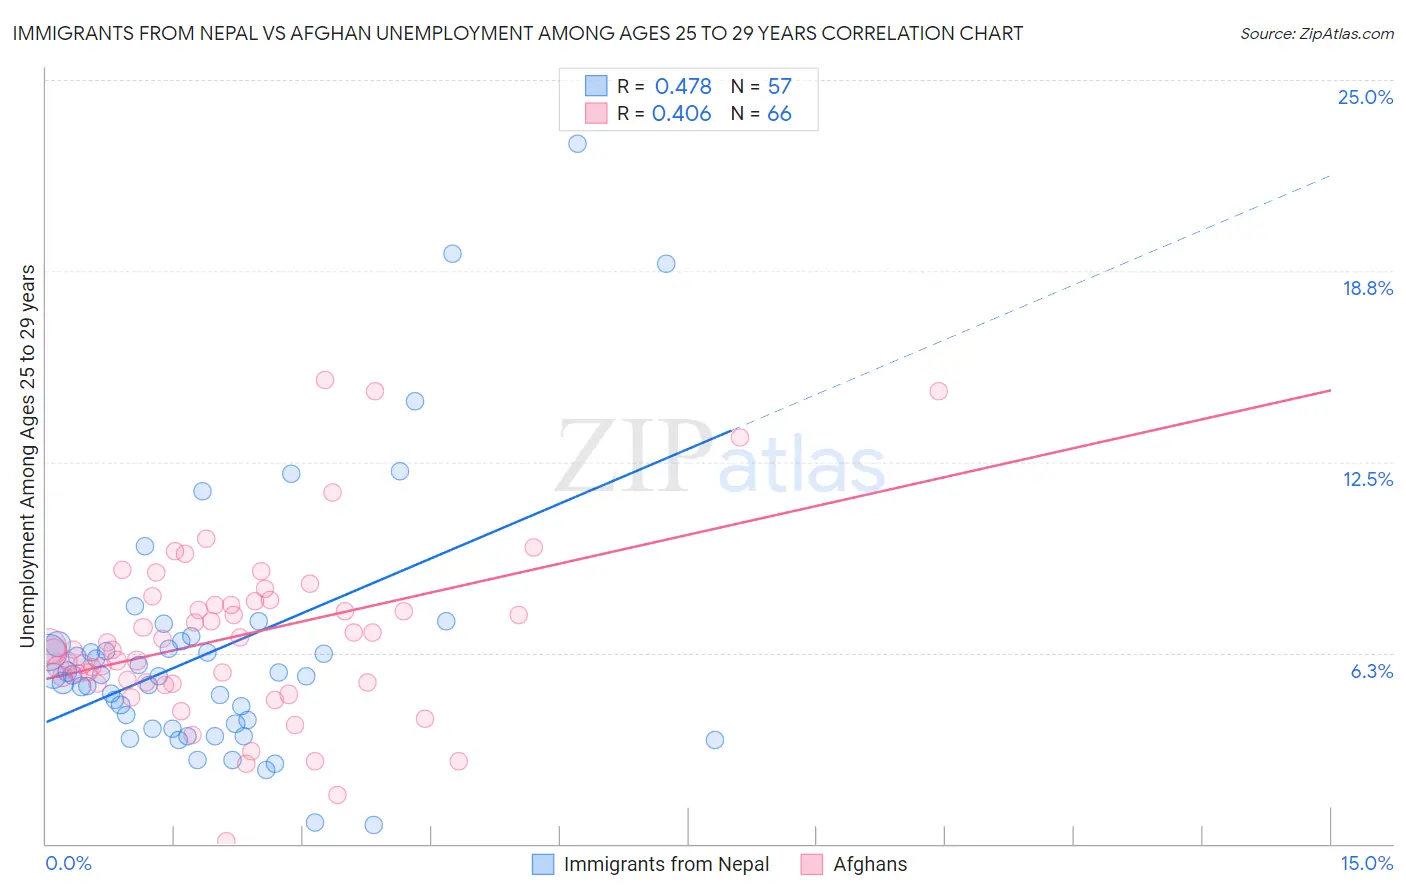
Immigrants from Nepal vs Afghan Unemployment Among Ages 25 to 29 years Correlation Chart
The statistical analysis conducted on geographies consisting of 183,035,443 people shows a moderate positive correlation between the proportion of Immigrants from Nepal and unemployment rate among population between the ages 25 and 29 in the United States with a correlation coefficient (R) of 0.478 and weighted average of 5.7%. Similarly, the statistical analysis conducted on geographies consisting of 147,163,258 people shows a moderate positive correlation between the proportion of Afghans and unemployment rate among population between the ages 25 and 29 in the United States with a correlation coefficient (R) of 0.406 and weighted average of 6.4%, a difference of 11.2%.
Unemployment Among Ages 25 to 29 years Correlation Summary
| Measurement | Immigrants from Nepal | Afghan |
| Minimum | 0.60% | 0.10% |
| Maximum | 22.9% | 15.2% |
| Range | 22.3% | 15.1% |
| Mean | 6.4% | 6.8% |
| Median | 5.5% | 6.4% |
| Interquartile 25% (IQ1) | 3.9% | 5.3% |
| Interquartile 75% (IQ3) | 6.6% | 7.9% |
| Interquartile Range (IQR) | 2.7% | 2.7% |
| Standard Deviation (Sample) | 4.2% | 2.9% |
| Standard Deviation (Population) | 4.2% | 2.8% |
Similar Demographics by Unemployment Among Ages 25 to 29 years
Demographics Similar to Immigrants from Nepal by Unemployment Among Ages 25 to 29 years
In terms of unemployment among ages 25 to 29 years, the demographic groups most similar to Immigrants from Nepal are Immigrants from Sudan (5.8%, a difference of 0.67%), Immigrants from Bosnia and Herzegovina (5.7%, a difference of 1.3%), Immigrants from India (5.7%, a difference of 1.4%), Hmong (5.7%, a difference of 1.5%), and Somali (5.6%, a difference of 1.7%).
| Demographics | Rating | Rank | Unemployment Among Ages 25 to 29 years |
| Tongans | 100.0 /100 | #2 | Exceptional 5.5% |
| Immigrants | Somalia | 100.0 /100 | #3 | Exceptional 5.5% |
| Immigrants | Cuba | 100.0 /100 | #4 | Exceptional 5.6% |
| Somalis | 100.0 /100 | #5 | Exceptional 5.6% |
| Hmong | 100.0 /100 | #6 | Exceptional 5.7% |
| Immigrants | India | 100.0 /100 | #7 | Exceptional 5.7% |
| Immigrants | Bosnia and Herzegovina | 100.0 /100 | #8 | Exceptional 5.7% |
| Immigrants | Nepal | 100.0 /100 | #9 | Exceptional 5.7% |
| Immigrants | Sudan | 100.0 /100 | #10 | Exceptional 5.8% |
| Cambodians | 100.0 /100 | #11 | Exceptional 5.8% |
| Okinawans | 100.0 /100 | #12 | Exceptional 5.9% |
| Immigrants | Bolivia | 100.0 /100 | #13 | Exceptional 5.9% |
| Immigrants | Kuwait | 99.9 /100 | #14 | Exceptional 5.9% |
| Cubans | 99.9 /100 | #15 | Exceptional 5.9% |
| Immigrants | Bulgaria | 99.9 /100 | #16 | Exceptional 5.9% |
Demographics Similar to Afghans by Unemployment Among Ages 25 to 29 years
In terms of unemployment among ages 25 to 29 years, the demographic groups most similar to Afghans are Immigrants from Brazil (6.4%, a difference of 0.080%), Immigrants from Eastern Europe (6.4%, a difference of 0.14%), Serbian (6.4%, a difference of 0.17%), Zimbabwean (6.4%, a difference of 0.24%), and Iraqi (6.4%, a difference of 0.25%).
| Demographics | Rating | Rank | Unemployment Among Ages 25 to 29 years |
| Immigrants | Indonesia | 94.5 /100 | #88 | Exceptional 6.4% |
| Immigrants | Oceania | 94.1 /100 | #89 | Exceptional 6.4% |
| Lebanese | 93.9 /100 | #90 | Exceptional 6.4% |
| Egyptians | 93.9 /100 | #91 | Exceptional 6.4% |
| Immigrants | North Macedonia | 93.6 /100 | #92 | Exceptional 6.4% |
| Australians | 93.6 /100 | #93 | Exceptional 6.4% |
| Zimbabweans | 93.5 /100 | #94 | Exceptional 6.4% |
| Afghans | 92.5 /100 | #95 | Exceptional 6.4% |
| Immigrants | Brazil | 92.1 /100 | #96 | Exceptional 6.4% |
| Immigrants | Eastern Europe | 91.9 /100 | #97 | Exceptional 6.4% |
| Serbians | 91.7 /100 | #98 | Exceptional 6.4% |
| Iraqis | 91.3 /100 | #99 | Exceptional 6.4% |
| Uruguayans | 91.2 /100 | #100 | Exceptional 6.4% |
| Immigrants | Ireland | 91.1 /100 | #101 | Exceptional 6.4% |
| British | 90.5 /100 | #102 | Exceptional 6.4% |