Chippewa vs Afghan Unemployment Among Ages 25 to 29 years
COMPARE
Chippewa
Afghan
Unemployment Among Ages 25 to 29 years
Unemployment Among Ages 25 to 29 years Comparison
Chippewa
Afghans
7.8%
UNEMPLOYMENT AMONG AGES 25 TO 29 YEARS
0.0/ 100
METRIC RATING
292nd/ 347
METRIC RANK
6.4%
UNEMPLOYMENT AMONG AGES 25 TO 29 YEARS
92.5/ 100
METRIC RATING
95th/ 347
METRIC RANK
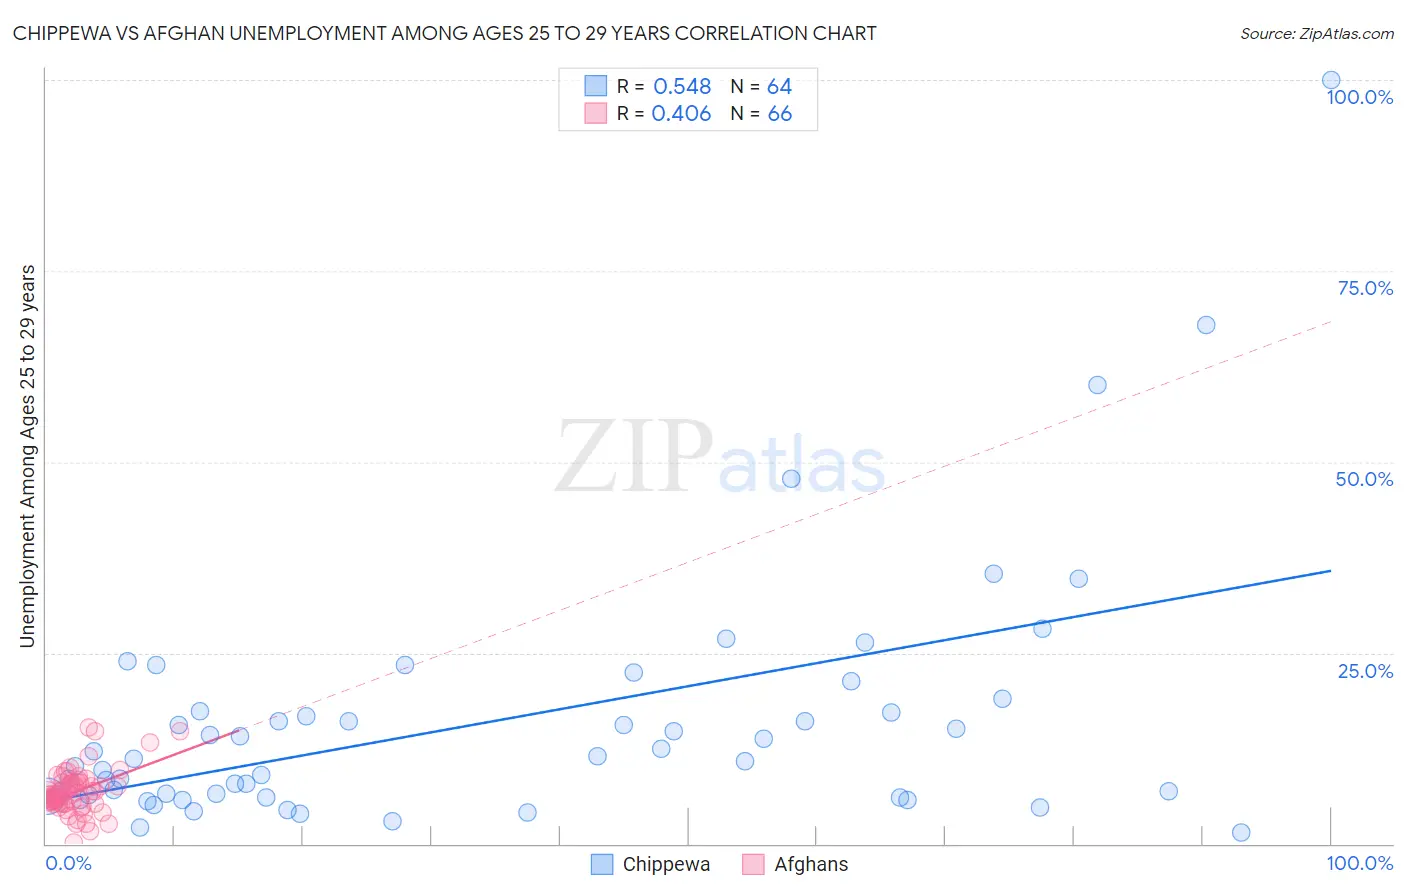
Chippewa vs Afghan Unemployment Among Ages 25 to 29 years Correlation Chart
The statistical analysis conducted on geographies consisting of 206,101,614 people shows a substantial positive correlation between the proportion of Chippewa and unemployment rate among population between the ages 25 and 29 in the United States with a correlation coefficient (R) of 0.548 and weighted average of 7.8%. Similarly, the statistical analysis conducted on geographies consisting of 147,163,258 people shows a moderate positive correlation between the proportion of Afghans and unemployment rate among population between the ages 25 and 29 in the United States with a correlation coefficient (R) of 0.406 and weighted average of 6.4%, a difference of 21.4%.
Unemployment Among Ages 25 to 29 years Correlation Summary
| Measurement | Chippewa | Afghan |
| Minimum | 1.4% | 0.10% |
| Maximum | 100.0% | 15.2% |
| Range | 98.6% | 15.1% |
| Mean | 15.8% | 6.8% |
| Median | 10.9% | 6.4% |
| Interquartile 25% (IQ1) | 6.2% | 5.3% |
| Interquartile 75% (IQ3) | 17.3% | 7.9% |
| Interquartile Range (IQR) | 11.1% | 2.7% |
| Standard Deviation (Sample) | 16.6% | 2.9% |
| Standard Deviation (Population) | 16.4% | 2.8% |
Similar Demographics by Unemployment Among Ages 25 to 29 years
Demographics Similar to Chippewa by Unemployment Among Ages 25 to 29 years
In terms of unemployment among ages 25 to 29 years, the demographic groups most similar to Chippewa are Immigrants from Belize (7.8%, a difference of 0.050%), Trinidadian and Tobagonian (7.8%, a difference of 0.33%), Hispanic or Latino (7.7%, a difference of 0.41%), Armenian (7.7%, a difference of 0.80%), and Comanche (7.8%, a difference of 0.80%).
| Demographics | Rating | Rank | Unemployment Among Ages 25 to 29 years |
| Senegalese | 0.0 /100 | #285 | Tragic 7.6% |
| Vietnamese | 0.0 /100 | #286 | Tragic 7.6% |
| Immigrants | Mexico | 0.0 /100 | #287 | Tragic 7.6% |
| Africans | 0.0 /100 | #288 | Tragic 7.6% |
| Belizeans | 0.0 /100 | #289 | Tragic 7.7% |
| Armenians | 0.0 /100 | #290 | Tragic 7.7% |
| Hispanics or Latinos | 0.0 /100 | #291 | Tragic 7.7% |
| Chippewa | 0.0 /100 | #292 | Tragic 7.8% |
| Immigrants | Belize | 0.0 /100 | #293 | Tragic 7.8% |
| Trinidadians and Tobagonians | 0.0 /100 | #294 | Tragic 7.8% |
| Comanche | 0.0 /100 | #295 | Tragic 7.8% |
| Immigrants | West Indies | 0.0 /100 | #296 | Tragic 7.8% |
| Blackfeet | 0.0 /100 | #297 | Tragic 7.9% |
| Immigrants | Trinidad and Tobago | 0.0 /100 | #298 | Tragic 7.9% |
| Barbadians | 0.0 /100 | #299 | Tragic 7.9% |
Demographics Similar to Afghans by Unemployment Among Ages 25 to 29 years
In terms of unemployment among ages 25 to 29 years, the demographic groups most similar to Afghans are Immigrants from Brazil (6.4%, a difference of 0.080%), Immigrants from Eastern Europe (6.4%, a difference of 0.14%), Serbian (6.4%, a difference of 0.17%), Zimbabwean (6.4%, a difference of 0.24%), and Iraqi (6.4%, a difference of 0.25%).
| Demographics | Rating | Rank | Unemployment Among Ages 25 to 29 years |
| Immigrants | Indonesia | 94.5 /100 | #88 | Exceptional 6.4% |
| Immigrants | Oceania | 94.1 /100 | #89 | Exceptional 6.4% |
| Lebanese | 93.9 /100 | #90 | Exceptional 6.4% |
| Egyptians | 93.9 /100 | #91 | Exceptional 6.4% |
| Immigrants | North Macedonia | 93.6 /100 | #92 | Exceptional 6.4% |
| Australians | 93.6 /100 | #93 | Exceptional 6.4% |
| Zimbabweans | 93.5 /100 | #94 | Exceptional 6.4% |
| Afghans | 92.5 /100 | #95 | Exceptional 6.4% |
| Immigrants | Brazil | 92.1 /100 | #96 | Exceptional 6.4% |
| Immigrants | Eastern Europe | 91.9 /100 | #97 | Exceptional 6.4% |
| Serbians | 91.7 /100 | #98 | Exceptional 6.4% |
| Iraqis | 91.3 /100 | #99 | Exceptional 6.4% |
| Uruguayans | 91.2 /100 | #100 | Exceptional 6.4% |
| Immigrants | Ireland | 91.1 /100 | #101 | Exceptional 6.4% |
| British | 90.5 /100 | #102 | Exceptional 6.4% |