Arapaho vs Immigrants from Japan Unemployment Among Ages 16 to 19 years
COMPARE
Arapaho
Immigrants from Japan
Unemployment Among Ages 16 to 19 years
Unemployment Among Ages 16 to 19 years Comparison
Arapaho
Immigrants from Japan
25.2%
UNEMPLOYMENT AMONG AGES 16 TO 19 YEARS
0.0/ 100
METRIC RATING
335th/ 347
METRIC RANK
16.6%
UNEMPLOYMENT AMONG AGES 16 TO 19 YEARS
98.9/ 100
METRIC RATING
65th/ 347
METRIC RANK
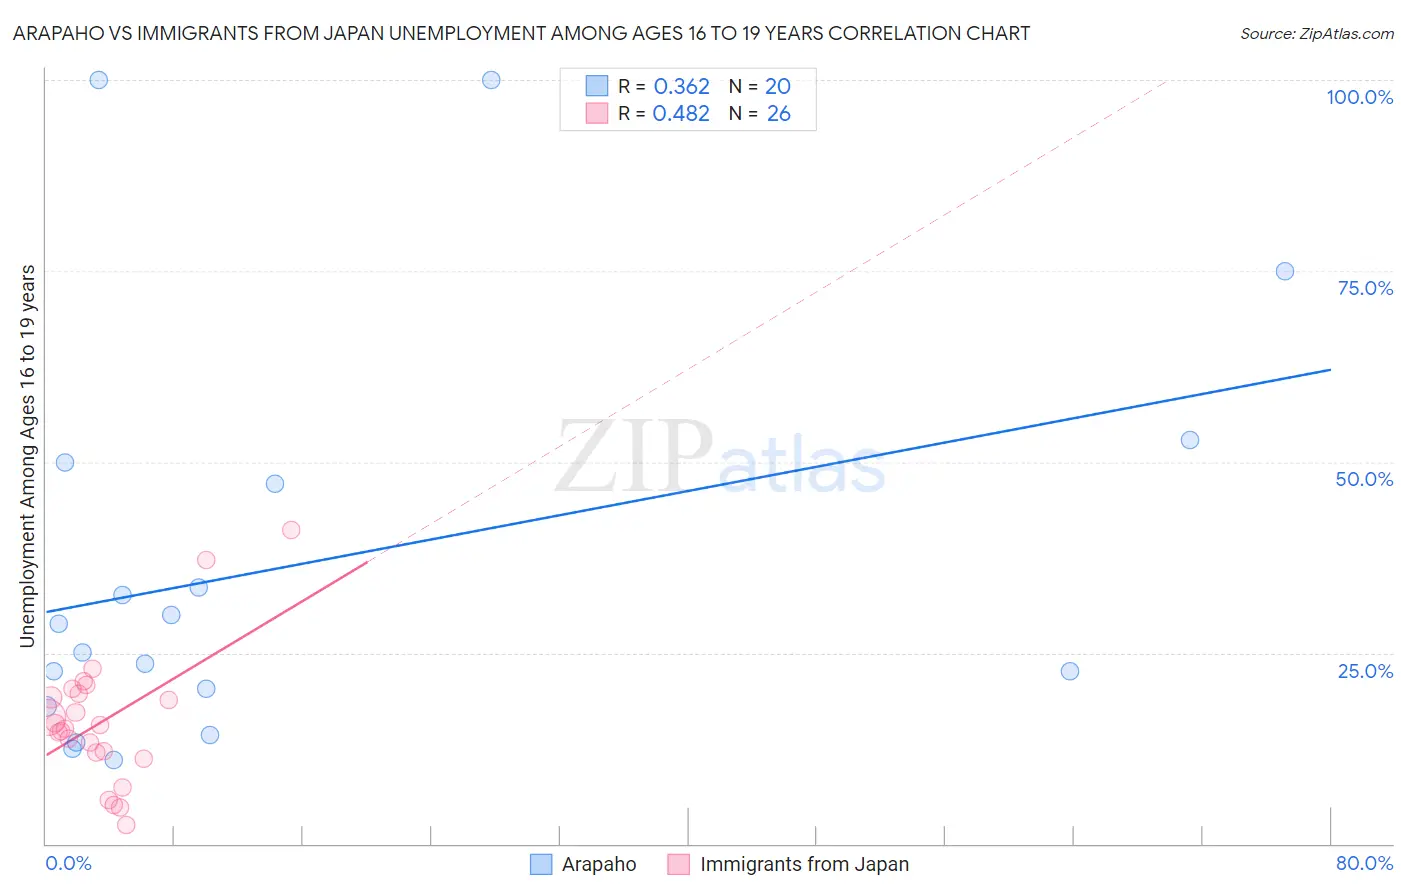
Arapaho vs Immigrants from Japan Unemployment Among Ages 16 to 19 years Correlation Chart
The statistical analysis conducted on geographies consisting of 29,524,713 people shows a mild positive correlation between the proportion of Arapaho and unemployment rate among population between the ages 16 and 19 in the United States with a correlation coefficient (R) of 0.362 and weighted average of 25.2%. Similarly, the statistical analysis conducted on geographies consisting of 326,097,714 people shows a moderate positive correlation between the proportion of Immigrants from Japan and unemployment rate among population between the ages 16 and 19 in the United States with a correlation coefficient (R) of 0.482 and weighted average of 16.6%, a difference of 51.2%.
Unemployment Among Ages 16 to 19 years Correlation Summary
| Measurement | Arapaho | Immigrants from Japan |
| Minimum | 10.9% | 2.4% |
| Maximum | 100.0% | 41.1% |
| Range | 89.1% | 38.7% |
| Mean | 36.6% | 16.1% |
| Median | 27.0% | 15.4% |
| Interquartile 25% (IQ1) | 19.2% | 12.0% |
| Interquartile 75% (IQ3) | 48.5% | 19.6% |
| Interquartile Range (IQR) | 29.4% | 7.6% |
| Standard Deviation (Sample) | 26.9% | 8.7% |
| Standard Deviation (Population) | 26.3% | 8.6% |
Similar Demographics by Unemployment Among Ages 16 to 19 years
Demographics Similar to Arapaho by Unemployment Among Ages 16 to 19 years
In terms of unemployment among ages 16 to 19 years, the demographic groups most similar to Arapaho are Kiowa (25.2%, a difference of 0.21%), Guyanese (24.8%, a difference of 1.3%), Immigrants from Guyana (25.5%, a difference of 1.3%), Immigrants from St. Vincent and the Grenadines (25.7%, a difference of 2.1%), and Immigrants from Grenada (25.7%, a difference of 2.3%).
| Demographics | Rating | Rank | Unemployment Among Ages 16 to 19 years |
| Immigrants | Dominican Republic | 0.0 /100 | #328 | Tragic 23.3% |
| Tlingit-Haida | 0.0 /100 | #329 | Tragic 23.5% |
| Dominicans | 0.0 /100 | #330 | Tragic 23.6% |
| British West Indians | 0.0 /100 | #331 | Tragic 24.0% |
| Immigrants | Barbados | 0.0 /100 | #332 | Tragic 24.0% |
| Paiute | 0.0 /100 | #333 | Tragic 24.4% |
| Guyanese | 0.0 /100 | #334 | Tragic 24.8% |
| Arapaho | 0.0 /100 | #335 | Tragic 25.2% |
| Kiowa | 0.0 /100 | #336 | Tragic 25.2% |
| Immigrants | Guyana | 0.0 /100 | #337 | Tragic 25.5% |
| Immigrants | St. Vincent and the Grenadines | 0.0 /100 | #338 | Tragic 25.7% |
| Immigrants | Grenada | 0.0 /100 | #339 | Tragic 25.7% |
| Crow | 0.0 /100 | #340 | Tragic 26.2% |
| Puerto Ricans | 0.0 /100 | #341 | Tragic 27.5% |
| Inupiat | 0.0 /100 | #342 | Tragic 28.1% |
Demographics Similar to Immigrants from Japan by Unemployment Among Ages 16 to 19 years
In terms of unemployment among ages 16 to 19 years, the demographic groups most similar to Immigrants from Japan are Okinawan (16.6%, a difference of 0.030%), Northern European (16.6%, a difference of 0.10%), Scotch-Irish (16.6%, a difference of 0.16%), Slavic (16.7%, a difference of 0.20%), and Chickasaw (16.7%, a difference of 0.20%).
| Demographics | Rating | Rank | Unemployment Among Ages 16 to 19 years |
| Immigrants | Uganda | 99.4 /100 | #58 | Exceptional 16.5% |
| Irish | 99.4 /100 | #59 | Exceptional 16.5% |
| Menominee | 99.3 /100 | #60 | Exceptional 16.6% |
| Immigrants | Cuba | 99.2 /100 | #61 | Exceptional 16.6% |
| Macedonians | 99.2 /100 | #62 | Exceptional 16.6% |
| Scotch-Irish | 99.1 /100 | #63 | Exceptional 16.6% |
| Northern Europeans | 99.0 /100 | #64 | Exceptional 16.6% |
| Immigrants | Japan | 98.9 /100 | #65 | Exceptional 16.6% |
| Okinawans | 98.9 /100 | #66 | Exceptional 16.6% |
| Slavs | 98.7 /100 | #67 | Exceptional 16.7% |
| Chickasaw | 98.7 /100 | #68 | Exceptional 16.7% |
| Serbians | 98.7 /100 | #69 | Exceptional 16.7% |
| Austrians | 98.6 /100 | #70 | Exceptional 16.7% |
| Latvians | 98.5 /100 | #71 | Exceptional 16.7% |
| Immigrants | Canada | 98.5 /100 | #72 | Exceptional 16.7% |