Ukrainian vs Immigrants from Turkey Unemployment Among Women with Children Under 18 years
COMPARE
Ukrainian
Immigrants from Turkey
Unemployment Among Women with Children Under 18 years
Unemployment Among Women with Children Under 18 years Comparison
Ukrainians
Immigrants from Turkey
5.2%
UNEMPLOYMENT AMONG WOMEN WITH CHILDREN UNDER 18 YEARS
93.8/ 100
METRIC RATING
90th/ 347
METRIC RANK
5.2%
UNEMPLOYMENT AMONG WOMEN WITH CHILDREN UNDER 18 YEARS
94.2/ 100
METRIC RATING
89th/ 347
METRIC RANK
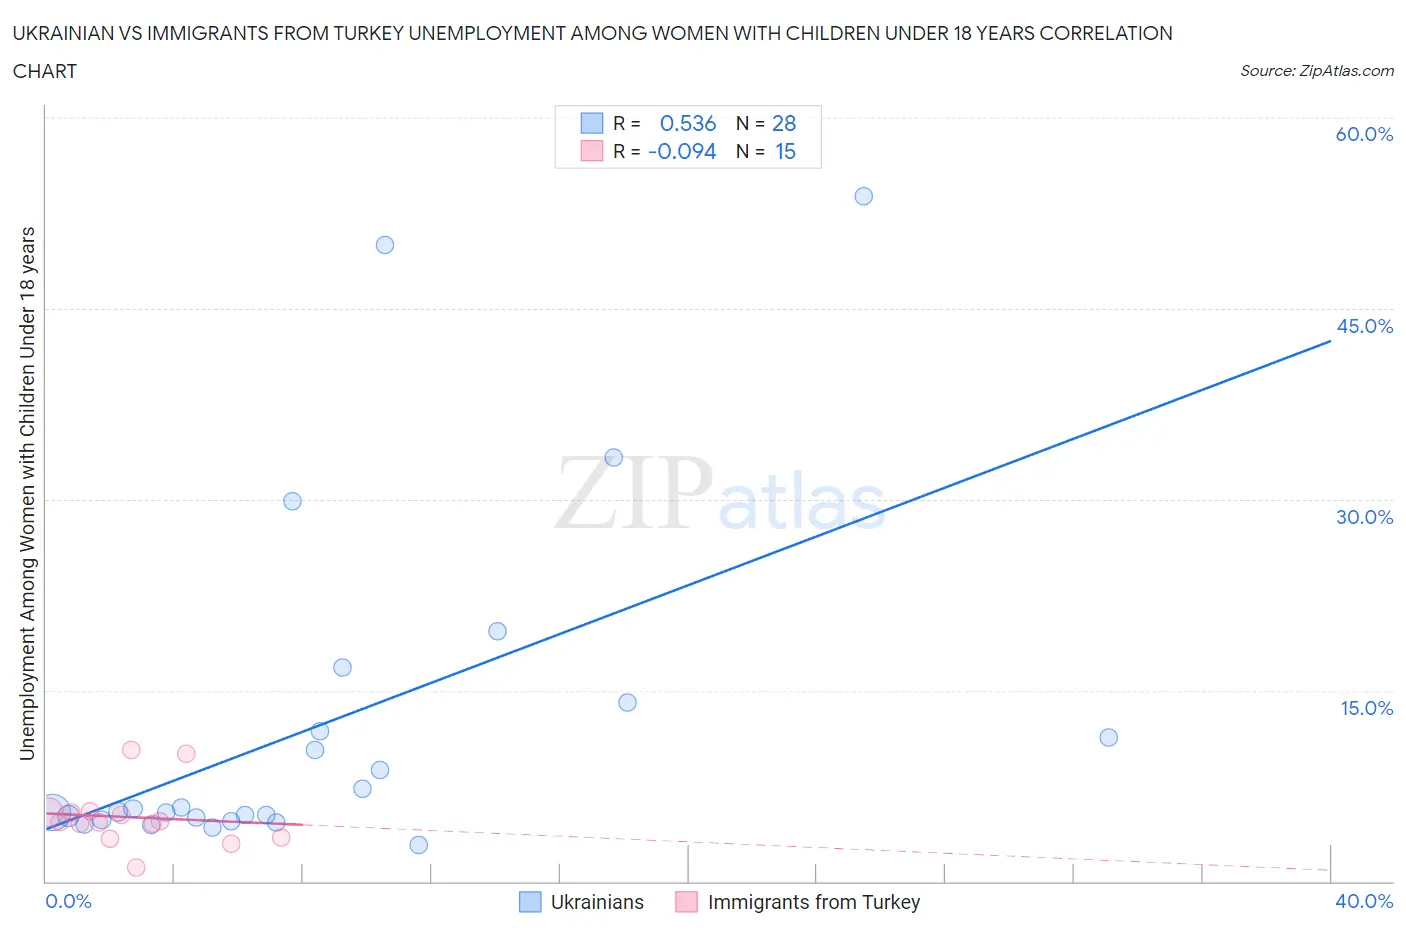
Ukrainian vs Immigrants from Turkey Unemployment Among Women with Children Under 18 years Correlation Chart
The statistical analysis conducted on geographies consisting of 422,457,638 people shows a substantial positive correlation between the proportion of Ukrainians and unemployment rate among women with children under the age of 18 in the United States with a correlation coefficient (R) of 0.536 and weighted average of 5.2%. Similarly, the statistical analysis conducted on geographies consisting of 218,285,752 people shows a slight negative correlation between the proportion of Immigrants from Turkey and unemployment rate among women with children under the age of 18 in the United States with a correlation coefficient (R) of -0.094 and weighted average of 5.2%, a difference of 0.13%.
Unemployment Among Women with Children Under 18 years Correlation Summary
| Measurement | Ukrainian | Immigrants from Turkey |
| Minimum | 2.8% | 1.1% |
| Maximum | 53.8% | 10.3% |
| Range | 51.0% | 9.2% |
| Mean | 12.3% | 5.0% |
| Median | 5.6% | 4.7% |
| Interquartile 25% (IQ1) | 5.0% | 3.4% |
| Interquartile 75% (IQ3) | 12.9% | 5.4% |
| Interquartile Range (IQR) | 7.9% | 2.0% |
| Standard Deviation (Sample) | 13.5% | 2.4% |
| Standard Deviation (Population) | 13.2% | 2.3% |
Demographics Similar to Ukrainians and Immigrants from Turkey by Unemployment Among Women with Children Under 18 years
In terms of unemployment among women with children under 18 years, the demographic groups most similar to Ukrainians are Immigrants from Zimbabwe (5.2%, a difference of 0.070%), Immigrants from Pakistan (5.2%, a difference of 0.16%), Immigrants from Canada (5.2%, a difference of 0.17%), Immigrants from Scotland (5.2%, a difference of 0.23%), and Laotian (5.2%, a difference of 0.30%). Similarly, the demographic groups most similar to Immigrants from Turkey are Immigrants from Scotland (5.2%, a difference of 0.10%), Laotian (5.2%, a difference of 0.17%), Immigrants from Indonesia (5.2%, a difference of 0.20%), Paraguayan (5.2%, a difference of 0.21%), and Immigrants from Zimbabwe (5.2%, a difference of 0.21%).
| Demographics | Rating | Rank | Unemployment Among Women with Children Under 18 years |
| Immigrants | Croatia | 95.6 /100 | #79 | Exceptional 5.1% |
| Bolivians | 95.5 /100 | #80 | Exceptional 5.1% |
| Immigrants | Lithuania | 95.4 /100 | #81 | Exceptional 5.2% |
| Romanians | 95.3 /100 | #82 | Exceptional 5.2% |
| Maltese | 95.1 /100 | #83 | Exceptional 5.2% |
| Australians | 95.1 /100 | #84 | Exceptional 5.2% |
| Paraguayans | 94.8 /100 | #85 | Exceptional 5.2% |
| Immigrants | Indonesia | 94.8 /100 | #86 | Exceptional 5.2% |
| Laotians | 94.7 /100 | #87 | Exceptional 5.2% |
| Immigrants | Scotland | 94.5 /100 | #88 | Exceptional 5.2% |
| Immigrants | Turkey | 94.2 /100 | #89 | Exceptional 5.2% |
| Ukrainians | 93.8 /100 | #90 | Exceptional 5.2% |
| Immigrants | Zimbabwe | 93.6 /100 | #91 | Exceptional 5.2% |
| Immigrants | Pakistan | 93.3 /100 | #92 | Exceptional 5.2% |
| Immigrants | Canada | 93.3 /100 | #93 | Exceptional 5.2% |
| Immigrants | Kuwait | 92.6 /100 | #94 | Exceptional 5.2% |
| Immigrants | North America | 92.3 /100 | #95 | Exceptional 5.2% |
| Immigrants | Albania | 92.2 /100 | #96 | Exceptional 5.2% |
| Palestinians | 92.2 /100 | #97 | Exceptional 5.2% |
| Immigrants | Vietnam | 92.0 /100 | #98 | Exceptional 5.2% |
| Cubans | 91.8 /100 | #99 | Exceptional 5.2% |