Estonian vs Immigrants from Turkey Unemployment Among Women with Children Under 18 years
COMPARE
Estonian
Immigrants from Turkey
Unemployment Among Women with Children Under 18 years
Unemployment Among Women with Children Under 18 years Comparison
Estonians
Immigrants from Turkey
5.1%
UNEMPLOYMENT AMONG WOMEN WITH CHILDREN UNDER 18 YEARS
97.2/ 100
METRIC RATING
64th/ 347
METRIC RANK
5.2%
UNEMPLOYMENT AMONG WOMEN WITH CHILDREN UNDER 18 YEARS
94.2/ 100
METRIC RATING
89th/ 347
METRIC RANK
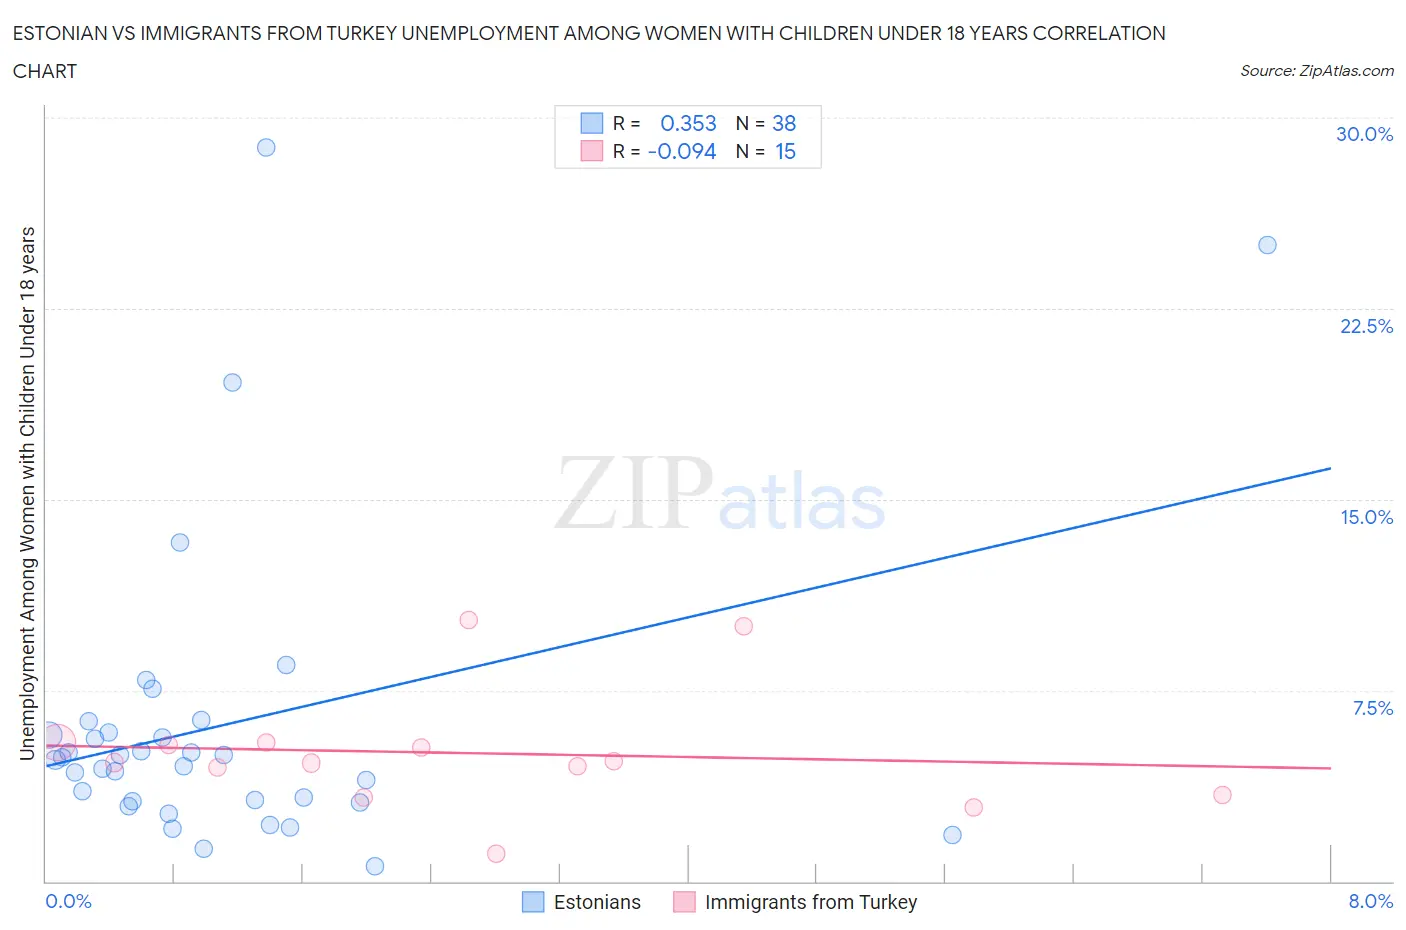
Estonian vs Immigrants from Turkey Unemployment Among Women with Children Under 18 years Correlation Chart
The statistical analysis conducted on geographies consisting of 121,191,816 people shows a mild positive correlation between the proportion of Estonians and unemployment rate among women with children under the age of 18 in the United States with a correlation coefficient (R) of 0.353 and weighted average of 5.1%. Similarly, the statistical analysis conducted on geographies consisting of 218,285,752 people shows a slight negative correlation between the proportion of Immigrants from Turkey and unemployment rate among women with children under the age of 18 in the United States with a correlation coefficient (R) of -0.094 and weighted average of 5.2%, a difference of 1.4%.
Unemployment Among Women with Children Under 18 years Correlation Summary
| Measurement | Estonian | Immigrants from Turkey |
| Minimum | 0.60% | 1.1% |
| Maximum | 28.8% | 10.3% |
| Range | 28.2% | 9.2% |
| Mean | 6.2% | 5.0% |
| Median | 4.8% | 4.7% |
| Interquartile 25% (IQ1) | 3.2% | 3.4% |
| Interquartile 75% (IQ3) | 5.8% | 5.4% |
| Interquartile Range (IQR) | 2.7% | 2.0% |
| Standard Deviation (Sample) | 6.0% | 2.4% |
| Standard Deviation (Population) | 5.9% | 2.3% |
Similar Demographics by Unemployment Among Women with Children Under 18 years
Demographics Similar to Estonians by Unemployment Among Women with Children Under 18 years
In terms of unemployment among women with children under 18 years, the demographic groups most similar to Estonians are Immigrants from Sweden (5.1%, a difference of 0.020%), Immigrants from Australia (5.1%, a difference of 0.12%), Fijian (5.1%, a difference of 0.14%), Italian (5.1%, a difference of 0.17%), and Immigrants from Bulgaria (5.1%, a difference of 0.19%).
| Demographics | Rating | Rank | Unemployment Among Women with Children Under 18 years |
| Czechoslovakians | 98.0 /100 | #57 | Exceptional 5.1% |
| Immigrants | Belgium | 97.9 /100 | #58 | Exceptional 5.1% |
| Asians | 97.9 /100 | #59 | Exceptional 5.1% |
| Welsh | 97.7 /100 | #60 | Exceptional 5.1% |
| Russians | 97.5 /100 | #61 | Exceptional 5.1% |
| Immigrants | Bulgaria | 97.4 /100 | #62 | Exceptional 5.1% |
| Italians | 97.4 /100 | #63 | Exceptional 5.1% |
| Estonians | 97.2 /100 | #64 | Exceptional 5.1% |
| Immigrants | Sweden | 97.1 /100 | #65 | Exceptional 5.1% |
| Immigrants | Australia | 97.0 /100 | #66 | Exceptional 5.1% |
| Fijians | 96.9 /100 | #67 | Exceptional 5.1% |
| Irish | 96.8 /100 | #68 | Exceptional 5.1% |
| Austrians | 96.6 /100 | #69 | Exceptional 5.1% |
| Icelanders | 96.6 /100 | #70 | Exceptional 5.1% |
| Serbians | 96.5 /100 | #71 | Exceptional 5.1% |
Demographics Similar to Immigrants from Turkey by Unemployment Among Women with Children Under 18 years
In terms of unemployment among women with children under 18 years, the demographic groups most similar to Immigrants from Turkey are Immigrants from Scotland (5.2%, a difference of 0.10%), Ukrainian (5.2%, a difference of 0.13%), Laotian (5.2%, a difference of 0.17%), Immigrants from Indonesia (5.2%, a difference of 0.20%), and Paraguayan (5.2%, a difference of 0.21%).
| Demographics | Rating | Rank | Unemployment Among Women with Children Under 18 years |
| Romanians | 95.3 /100 | #82 | Exceptional 5.2% |
| Maltese | 95.1 /100 | #83 | Exceptional 5.2% |
| Australians | 95.1 /100 | #84 | Exceptional 5.2% |
| Paraguayans | 94.8 /100 | #85 | Exceptional 5.2% |
| Immigrants | Indonesia | 94.8 /100 | #86 | Exceptional 5.2% |
| Laotians | 94.7 /100 | #87 | Exceptional 5.2% |
| Immigrants | Scotland | 94.5 /100 | #88 | Exceptional 5.2% |
| Immigrants | Turkey | 94.2 /100 | #89 | Exceptional 5.2% |
| Ukrainians | 93.8 /100 | #90 | Exceptional 5.2% |
| Immigrants | Zimbabwe | 93.6 /100 | #91 | Exceptional 5.2% |
| Immigrants | Pakistan | 93.3 /100 | #92 | Exceptional 5.2% |
| Immigrants | Canada | 93.3 /100 | #93 | Exceptional 5.2% |
| Immigrants | Kuwait | 92.6 /100 | #94 | Exceptional 5.2% |
| Immigrants | North America | 92.3 /100 | #95 | Exceptional 5.2% |
| Immigrants | Albania | 92.2 /100 | #96 | Exceptional 5.2% |