Israeli vs Immigrants from Laos Unemployment Among Women with Children Under 6 years
COMPARE
Israeli
Immigrants from Laos
Unemployment Among Women with Children Under 6 years
Unemployment Among Women with Children Under 6 years Comparison
Israelis
Immigrants from Laos
7.2%
UNEMPLOYMENT AMONG WOMEN WITH CHILDREN UNDER 6 YEARS
96.5/ 100
METRIC RATING
112th/ 347
METRIC RANK
7.6%
UNEMPLOYMENT AMONG WOMEN WITH CHILDREN UNDER 6 YEARS
50.0/ 100
METRIC RATING
174th/ 347
METRIC RANK
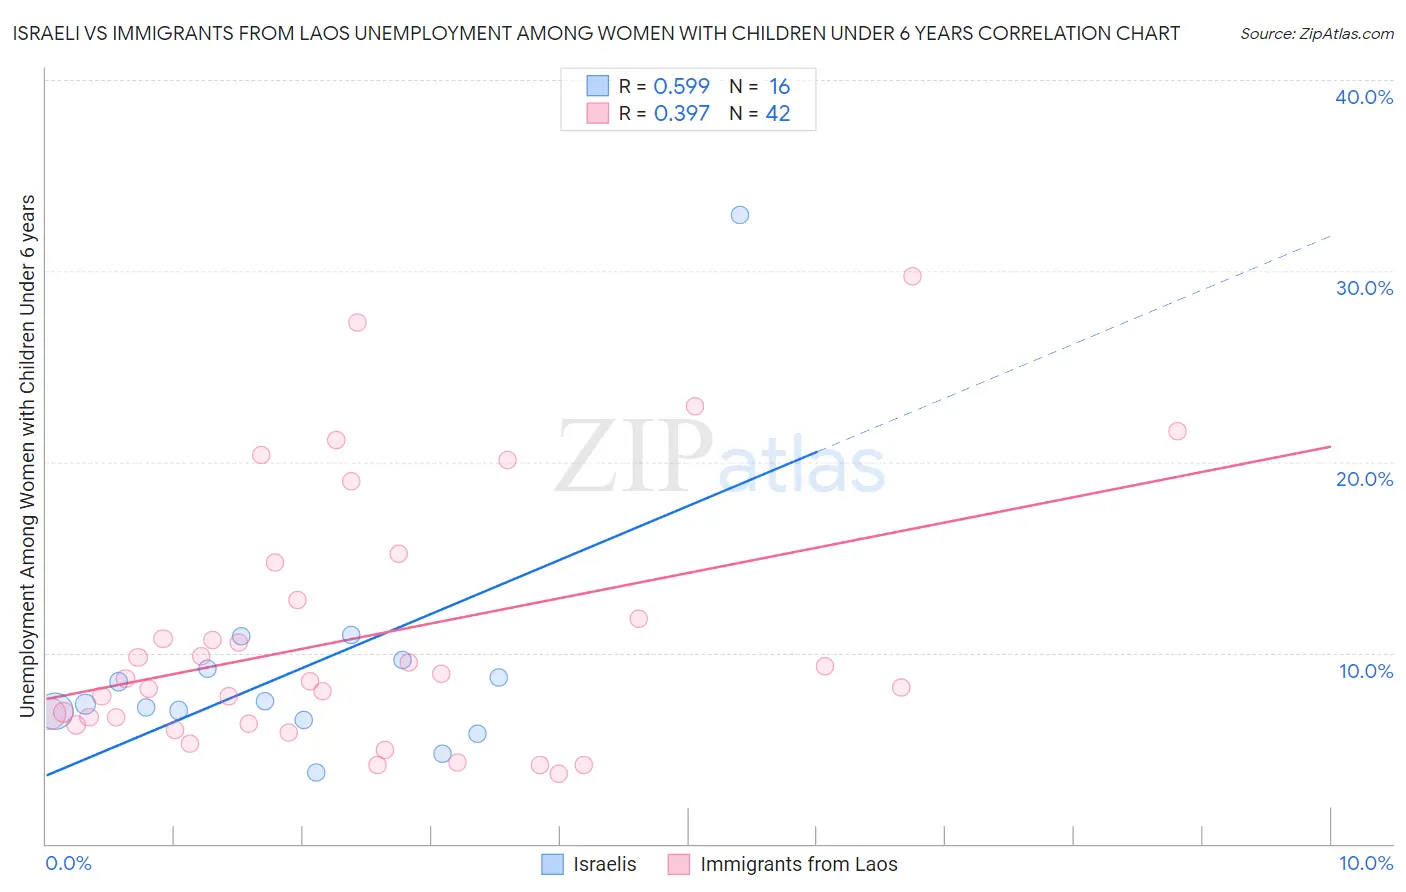
Israeli vs Immigrants from Laos Unemployment Among Women with Children Under 6 years Correlation Chart
The statistical analysis conducted on geographies consisting of 176,996,963 people shows a substantial positive correlation between the proportion of Israelis and unemployment rate among women with children under the age of 6 in the United States with a correlation coefficient (R) of 0.599 and weighted average of 7.2%. Similarly, the statistical analysis conducted on geographies consisting of 170,684,767 people shows a mild positive correlation between the proportion of Immigrants from Laos and unemployment rate among women with children under the age of 6 in the United States with a correlation coefficient (R) of 0.397 and weighted average of 7.6%, a difference of 5.8%.
Unemployment Among Women with Children Under 6 years Correlation Summary
| Measurement | Israeli | Immigrants from Laos |
| Minimum | 3.8% | 3.7% |
| Maximum | 32.9% | 29.7% |
| Range | 29.1% | 26.0% |
| Mean | 9.2% | 10.8% |
| Median | 7.4% | 8.6% |
| Interquartile 25% (IQ1) | 6.7% | 6.3% |
| Interquartile 75% (IQ3) | 9.4% | 12.8% |
| Interquartile Range (IQR) | 2.7% | 6.5% |
| Standard Deviation (Sample) | 6.6% | 6.6% |
| Standard Deviation (Population) | 6.4% | 6.5% |
Similar Demographics by Unemployment Among Women with Children Under 6 years
Demographics Similar to Israelis by Unemployment Among Women with Children Under 6 years
In terms of unemployment among women with children under 6 years, the demographic groups most similar to Israelis are Nicaraguan (7.2%, a difference of 0.080%), Norwegian (7.2%, a difference of 0.11%), Argentinean (7.2%, a difference of 0.12%), Palestinian (7.2%, a difference of 0.17%), and Immigrants from Italy (7.2%, a difference of 0.20%).
| Demographics | Rating | Rank | Unemployment Among Women with Children Under 6 years |
| Venezuelans | 97.2 /100 | #105 | Exceptional 7.2% |
| Immigrants | Pakistan | 97.2 /100 | #106 | Exceptional 7.2% |
| Immigrants | Kazakhstan | 97.1 /100 | #107 | Exceptional 7.2% |
| Eastern Europeans | 96.9 /100 | #108 | Exceptional 7.2% |
| Australians | 96.9 /100 | #109 | Exceptional 7.2% |
| Palestinians | 96.8 /100 | #110 | Exceptional 7.2% |
| Norwegians | 96.7 /100 | #111 | Exceptional 7.2% |
| Israelis | 96.5 /100 | #112 | Exceptional 7.2% |
| Nicaraguans | 96.3 /100 | #113 | Exceptional 7.2% |
| Argentineans | 96.2 /100 | #114 | Exceptional 7.2% |
| Immigrants | Italy | 96.1 /100 | #115 | Exceptional 7.2% |
| Armenians | 95.9 /100 | #116 | Exceptional 7.2% |
| Immigrants | Kenya | 95.4 /100 | #117 | Exceptional 7.3% |
| Serbians | 94.5 /100 | #118 | Exceptional 7.3% |
| South Africans | 94.1 /100 | #119 | Exceptional 7.3% |
Demographics Similar to Immigrants from Laos by Unemployment Among Women with Children Under 6 years
In terms of unemployment among women with children under 6 years, the demographic groups most similar to Immigrants from Laos are Panamanian (7.6%, a difference of 0.020%), Cree (7.6%, a difference of 0.11%), Puget Sound Salish (7.7%, a difference of 0.15%), Austrian (7.7%, a difference of 0.27%), and Immigrants from England (7.7%, a difference of 0.31%).
| Demographics | Rating | Rank | Unemployment Among Women with Children Under 6 years |
| Kenyans | 62.5 /100 | #167 | Good 7.6% |
| Immigrants | Canada | 61.6 /100 | #168 | Good 7.6% |
| Immigrants | Scotland | 61.3 /100 | #169 | Good 7.6% |
| Czechs | 59.8 /100 | #170 | Average 7.6% |
| Immigrants | Grenada | 59.0 /100 | #171 | Average 7.6% |
| Immigrants | North America | 57.7 /100 | #172 | Average 7.6% |
| Cree | 51.6 /100 | #173 | Average 7.6% |
| Immigrants | Laos | 50.0 /100 | #174 | Average 7.6% |
| Panamanians | 49.6 /100 | #175 | Average 7.6% |
| Puget Sound Salish | 47.7 /100 | #176 | Average 7.7% |
| Austrians | 46.0 /100 | #177 | Average 7.7% |
| Immigrants | England | 45.4 /100 | #178 | Average 7.7% |
| Immigrants | Western Europe | 44.9 /100 | #179 | Average 7.7% |
| Immigrants | Uruguay | 44.5 /100 | #180 | Average 7.7% |
| Brazilians | 43.9 /100 | #181 | Average 7.7% |