Israeli vs Venezuelan Unemployment Among Women with Children Under 6 years
COMPARE
Israeli
Venezuelan
Unemployment Among Women with Children Under 6 years
Unemployment Among Women with Children Under 6 years Comparison
Israelis
Venezuelans
7.2%
UNEMPLOYMENT AMONG WOMEN WITH CHILDREN UNDER 6 YEARS
96.5/ 100
METRIC RATING
112th/ 347
METRIC RANK
7.2%
UNEMPLOYMENT AMONG WOMEN WITH CHILDREN UNDER 6 YEARS
97.2/ 100
METRIC RATING
105th/ 347
METRIC RANK
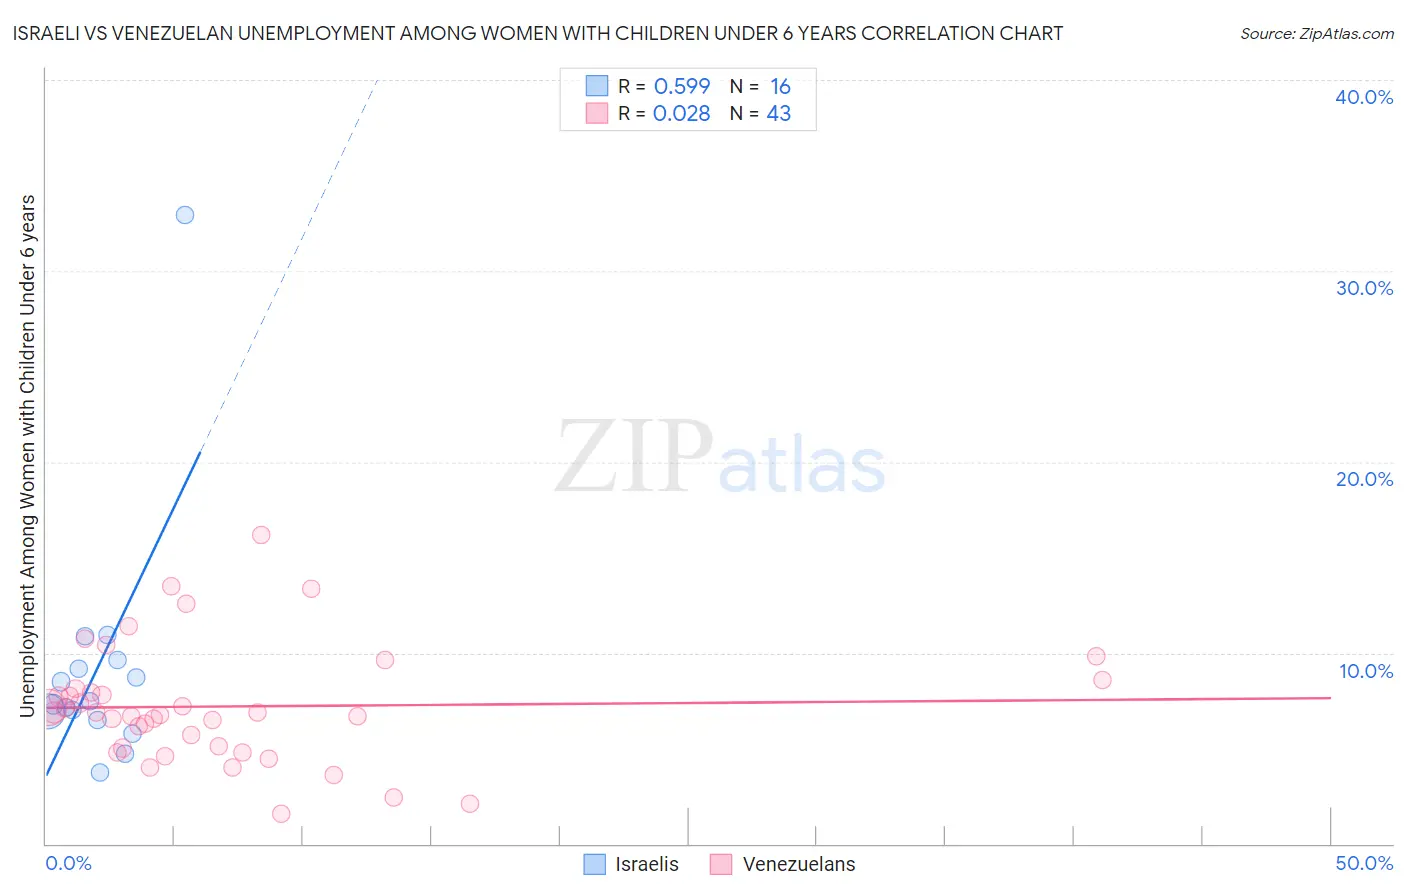
Israeli vs Venezuelan Unemployment Among Women with Children Under 6 years Correlation Chart
The statistical analysis conducted on geographies consisting of 176,996,963 people shows a substantial positive correlation between the proportion of Israelis and unemployment rate among women with children under the age of 6 in the United States with a correlation coefficient (R) of 0.599 and weighted average of 7.2%. Similarly, the statistical analysis conducted on geographies consisting of 246,662,940 people shows no correlation between the proportion of Venezuelans and unemployment rate among women with children under the age of 6 in the United States with a correlation coefficient (R) of 0.028 and weighted average of 7.2%, a difference of 0.40%.
Unemployment Among Women with Children Under 6 years Correlation Summary
| Measurement | Israeli | Venezuelan |
| Minimum | 3.8% | 1.6% |
| Maximum | 32.9% | 16.2% |
| Range | 29.1% | 14.6% |
| Mean | 9.2% | 7.2% |
| Median | 7.4% | 6.9% |
| Interquartile 25% (IQ1) | 6.7% | 5.0% |
| Interquartile 75% (IQ3) | 9.4% | 8.1% |
| Interquartile Range (IQR) | 2.7% | 3.1% |
| Standard Deviation (Sample) | 6.6% | 3.1% |
| Standard Deviation (Population) | 6.4% | 3.1% |
Demographics Similar to Israelis and Venezuelans by Unemployment Among Women with Children Under 6 years
In terms of unemployment among women with children under 6 years, the demographic groups most similar to Israelis are Nicaraguan (7.2%, a difference of 0.080%), Norwegian (7.2%, a difference of 0.11%), Argentinean (7.2%, a difference of 0.12%), Palestinian (7.2%, a difference of 0.17%), and Immigrants from Italy (7.2%, a difference of 0.20%). Similarly, the demographic groups most similar to Venezuelans are Immigrants from Egypt (7.2%, a difference of 0.010%), Immigrants from Pakistan (7.2%, a difference of 0.010%), Immigrants from Kazakhstan (7.2%, a difference of 0.030%), Immigrants from Nicaragua (7.2%, a difference of 0.090%), and Immigrants from Saudi Arabia (7.2%, a difference of 0.090%).
| Demographics | Rating | Rank | Unemployment Among Women with Children Under 6 years |
| Russians | 97.5 /100 | #98 | Exceptional 7.2% |
| Immigrants | Europe | 97.5 /100 | #99 | Exceptional 7.2% |
| Immigrants | Northern Europe | 97.4 /100 | #100 | Exceptional 7.2% |
| Chileans | 97.4 /100 | #101 | Exceptional 7.2% |
| Immigrants | Nicaragua | 97.3 /100 | #102 | Exceptional 7.2% |
| Immigrants | Saudi Arabia | 97.3 /100 | #103 | Exceptional 7.2% |
| Immigrants | Egypt | 97.2 /100 | #104 | Exceptional 7.2% |
| Venezuelans | 97.2 /100 | #105 | Exceptional 7.2% |
| Immigrants | Pakistan | 97.2 /100 | #106 | Exceptional 7.2% |
| Immigrants | Kazakhstan | 97.1 /100 | #107 | Exceptional 7.2% |
| Eastern Europeans | 96.9 /100 | #108 | Exceptional 7.2% |
| Australians | 96.9 /100 | #109 | Exceptional 7.2% |
| Palestinians | 96.8 /100 | #110 | Exceptional 7.2% |
| Norwegians | 96.7 /100 | #111 | Exceptional 7.2% |
| Israelis | 96.5 /100 | #112 | Exceptional 7.2% |
| Nicaraguans | 96.3 /100 | #113 | Exceptional 7.2% |
| Argentineans | 96.2 /100 | #114 | Exceptional 7.2% |
| Immigrants | Italy | 96.1 /100 | #115 | Exceptional 7.2% |
| Armenians | 95.9 /100 | #116 | Exceptional 7.2% |
| Immigrants | Kenya | 95.4 /100 | #117 | Exceptional 7.3% |
| Serbians | 94.5 /100 | #118 | Exceptional 7.3% |