Israeli vs Immigrants from Taiwan Unemployment Among Women with Children Under 6 years
COMPARE
Israeli
Immigrants from Taiwan
Unemployment Among Women with Children Under 6 years
Unemployment Among Women with Children Under 6 years Comparison
Israelis
Immigrants from Taiwan
7.2%
UNEMPLOYMENT AMONG WOMEN WITH CHILDREN UNDER 6 YEARS
96.5/ 100
METRIC RATING
112th/ 347
METRIC RANK
6.0%
UNEMPLOYMENT AMONG WOMEN WITH CHILDREN UNDER 6 YEARS
100.0/ 100
METRIC RATING
6th/ 347
METRIC RANK
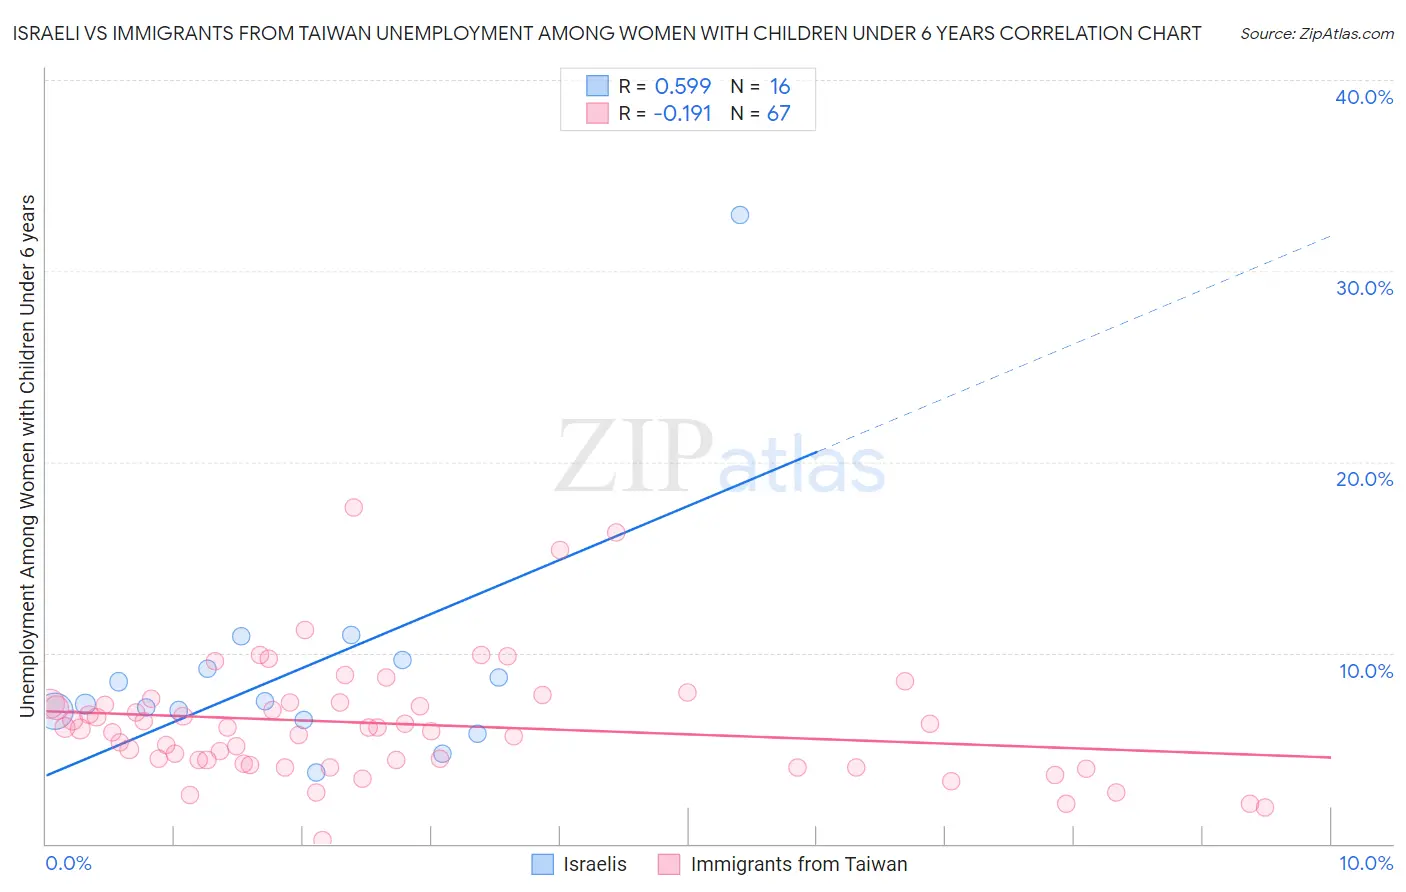
Israeli vs Immigrants from Taiwan Unemployment Among Women with Children Under 6 years Correlation Chart
The statistical analysis conducted on geographies consisting of 176,996,963 people shows a substantial positive correlation between the proportion of Israelis and unemployment rate among women with children under the age of 6 in the United States with a correlation coefficient (R) of 0.599 and weighted average of 7.2%. Similarly, the statistical analysis conducted on geographies consisting of 239,471,735 people shows a poor negative correlation between the proportion of Immigrants from Taiwan and unemployment rate among women with children under the age of 6 in the United States with a correlation coefficient (R) of -0.191 and weighted average of 6.0%, a difference of 19.5%.
Unemployment Among Women with Children Under 6 years Correlation Summary
| Measurement | Israeli | Immigrants from Taiwan |
| Minimum | 3.8% | 0.20% |
| Maximum | 32.9% | 17.6% |
| Range | 29.1% | 17.4% |
| Mean | 9.2% | 6.3% |
| Median | 7.4% | 6.1% |
| Interquartile 25% (IQ1) | 6.7% | 4.2% |
| Interquartile 75% (IQ3) | 9.4% | 7.4% |
| Interquartile Range (IQR) | 2.7% | 3.2% |
| Standard Deviation (Sample) | 6.6% | 3.1% |
| Standard Deviation (Population) | 6.4% | 3.1% |
Similar Demographics by Unemployment Among Women with Children Under 6 years
Demographics Similar to Israelis by Unemployment Among Women with Children Under 6 years
In terms of unemployment among women with children under 6 years, the demographic groups most similar to Israelis are Nicaraguan (7.2%, a difference of 0.080%), Norwegian (7.2%, a difference of 0.11%), Argentinean (7.2%, a difference of 0.12%), Palestinian (7.2%, a difference of 0.17%), and Immigrants from Italy (7.2%, a difference of 0.20%).
| Demographics | Rating | Rank | Unemployment Among Women with Children Under 6 years |
| Venezuelans | 97.2 /100 | #105 | Exceptional 7.2% |
| Immigrants | Pakistan | 97.2 /100 | #106 | Exceptional 7.2% |
| Immigrants | Kazakhstan | 97.1 /100 | #107 | Exceptional 7.2% |
| Eastern Europeans | 96.9 /100 | #108 | Exceptional 7.2% |
| Australians | 96.9 /100 | #109 | Exceptional 7.2% |
| Palestinians | 96.8 /100 | #110 | Exceptional 7.2% |
| Norwegians | 96.7 /100 | #111 | Exceptional 7.2% |
| Israelis | 96.5 /100 | #112 | Exceptional 7.2% |
| Nicaraguans | 96.3 /100 | #113 | Exceptional 7.2% |
| Argentineans | 96.2 /100 | #114 | Exceptional 7.2% |
| Immigrants | Italy | 96.1 /100 | #115 | Exceptional 7.2% |
| Armenians | 95.9 /100 | #116 | Exceptional 7.2% |
| Immigrants | Kenya | 95.4 /100 | #117 | Exceptional 7.3% |
| Serbians | 94.5 /100 | #118 | Exceptional 7.3% |
| South Africans | 94.1 /100 | #119 | Exceptional 7.3% |
Demographics Similar to Immigrants from Taiwan by Unemployment Among Women with Children Under 6 years
In terms of unemployment among women with children under 6 years, the demographic groups most similar to Immigrants from Taiwan are Taiwanese (6.1%, a difference of 0.52%), Immigrants from India (6.1%, a difference of 1.0%), Filipino (6.1%, a difference of 1.5%), Cape Verdean (5.9%, a difference of 1.7%), and Cambodian (5.9%, a difference of 2.7%).
| Demographics | Rating | Rank | Unemployment Among Women with Children Under 6 years |
| Immigrants | Cabo Verde | 100.0 /100 | #1 | Exceptional 5.4% |
| Immigrants | Hong Kong | 100.0 /100 | #2 | Exceptional 5.8% |
| Okinawans | 100.0 /100 | #3 | Exceptional 5.8% |
| Cambodians | 100.0 /100 | #4 | Exceptional 5.9% |
| Cape Verdeans | 100.0 /100 | #5 | Exceptional 5.9% |
| Immigrants | Taiwan | 100.0 /100 | #6 | Exceptional 6.0% |
| Taiwanese | 100.0 /100 | #7 | Exceptional 6.1% |
| Immigrants | India | 100.0 /100 | #8 | Exceptional 6.1% |
| Filipinos | 100.0 /100 | #9 | Exceptional 6.1% |
| Immigrants | China | 100.0 /100 | #10 | Exceptional 6.2% |
| Indians (Asian) | 100.0 /100 | #11 | Exceptional 6.3% |
| Immigrants | Singapore | 100.0 /100 | #12 | Exceptional 6.3% |
| Immigrants | Eastern Asia | 100.0 /100 | #13 | Exceptional 6.3% |
| Immigrants | Bulgaria | 100.0 /100 | #14 | Exceptional 6.3% |
| Thais | 100.0 /100 | #15 | Exceptional 6.3% |