Irish vs Kenyan 12th Grade, No Diploma
COMPARE
Irish
Kenyan
12th Grade, No Diploma
12th Grade, No Diploma Comparison
Irish
Kenyans
93.0%
12TH GRADE, NO DIPLOMA
99.9/ 100
METRIC RATING
37th/ 347
METRIC RANK
91.5%
12TH GRADE, NO DIPLOMA
77.4/ 100
METRIC RATING
152nd/ 347
METRIC RANK
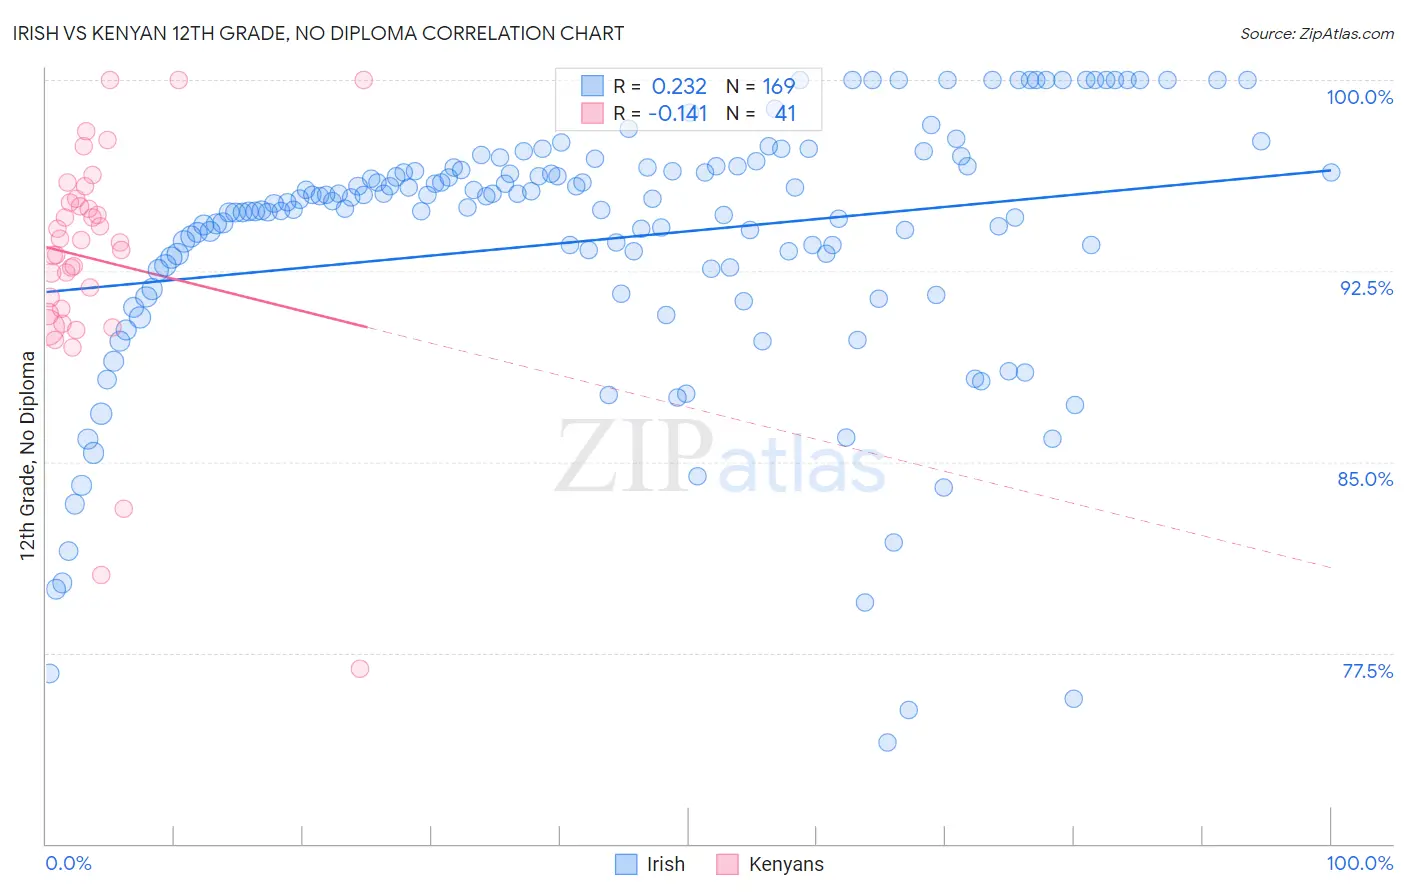
Irish vs Kenyan 12th Grade, No Diploma Correlation Chart
The statistical analysis conducted on geographies consisting of 580,710,123 people shows a weak positive correlation between the proportion of Irish and percentage of population with at least 12th grade (no diploma) education in the United States with a correlation coefficient (R) of 0.232 and weighted average of 93.0%. Similarly, the statistical analysis conducted on geographies consisting of 168,243,895 people shows a poor negative correlation between the proportion of Kenyans and percentage of population with at least 12th grade (no diploma) education in the United States with a correlation coefficient (R) of -0.141 and weighted average of 91.5%, a difference of 1.6%.
12th Grade, No Diploma Correlation Summary
| Measurement | Irish | Kenyan |
| Minimum | 74.0% | 76.9% |
| Maximum | 100.0% | 100.0% |
| Range | 26.0% | 23.1% |
| Mean | 93.7% | 92.9% |
| Median | 95.1% | 93.6% |
| Interquartile 25% (IQ1) | 92.6% | 90.9% |
| Interquartile 75% (IQ3) | 96.6% | 95.3% |
| Interquartile Range (IQR) | 4.0% | 4.3% |
| Standard Deviation (Sample) | 5.3% | 4.6% |
| Standard Deviation (Population) | 5.2% | 4.5% |
Similar Demographics by 12th Grade, No Diploma
Demographics Similar to Irish by 12th Grade, No Diploma
In terms of 12th grade, no diploma, the demographic groups most similar to Irish are Scottish (93.0%, a difference of 0.0%), Okinawan (93.0%, a difference of 0.010%), English (93.0%, a difference of 0.010%), Immigrants from Scotland (93.0%, a difference of 0.030%), and Tlingit-Haida (93.0%, a difference of 0.030%).
| Demographics | Rating | Rank | 12th Grade, No Diploma |
| Immigrants | Lithuania | 99.9 /100 | #30 | Exceptional 93.1% |
| Immigrants | Ireland | 99.9 /100 | #31 | Exceptional 93.1% |
| Europeans | 99.9 /100 | #32 | Exceptional 93.1% |
| Immigrants | Scotland | 99.9 /100 | #33 | Exceptional 93.0% |
| Okinawans | 99.9 /100 | #34 | Exceptional 93.0% |
| English | 99.9 /100 | #35 | Exceptional 93.0% |
| Scottish | 99.9 /100 | #36 | Exceptional 93.0% |
| Irish | 99.9 /100 | #37 | Exceptional 93.0% |
| Tlingit-Haida | 99.8 /100 | #38 | Exceptional 93.0% |
| Immigrants | Austria | 99.8 /100 | #39 | Exceptional 93.0% |
| Turks | 99.8 /100 | #40 | Exceptional 93.0% |
| Bhutanese | 99.8 /100 | #41 | Exceptional 93.0% |
| Immigrants | Australia | 99.8 /100 | #42 | Exceptional 92.9% |
| Northern Europeans | 99.8 /100 | #43 | Exceptional 92.9% |
| Dutch | 99.8 /100 | #44 | Exceptional 92.9% |
Demographics Similar to Kenyans by 12th Grade, No Diploma
In terms of 12th grade, no diploma, the demographic groups most similar to Kenyans are Ugandan (91.5%, a difference of 0.030%), Paraguayan (91.5%, a difference of 0.030%), Chippewa (91.5%, a difference of 0.030%), Iraqi (91.5%, a difference of 0.030%), and Immigrants from Brazil (91.5%, a difference of 0.040%).
| Demographics | Rating | Rank | 12th Grade, No Diploma |
| Immigrants | Lebanon | 80.0 /100 | #145 | Excellent 91.6% |
| Immigrants | Brazil | 79.8 /100 | #146 | Good 91.5% |
| Pakistanis | 79.6 /100 | #147 | Good 91.5% |
| Indians (Asian) | 79.4 /100 | #148 | Good 91.5% |
| Ugandans | 79.0 /100 | #149 | Good 91.5% |
| Paraguayans | 78.9 /100 | #150 | Good 91.5% |
| Chippewa | 78.8 /100 | #151 | Good 91.5% |
| Kenyans | 77.4 /100 | #152 | Good 91.5% |
| Iraqis | 75.3 /100 | #153 | Good 91.5% |
| Immigrants | Kenya | 73.9 /100 | #154 | Good 91.5% |
| Immigrants | Iraq | 73.0 /100 | #155 | Good 91.4% |
| Asians | 71.9 /100 | #156 | Good 91.4% |
| Immigrants | Pakistan | 70.7 /100 | #157 | Good 91.4% |
| Immigrants | Northern Africa | 66.2 /100 | #158 | Good 91.4% |
| Laotians | 64.4 /100 | #159 | Good 91.3% |