Irish vs Guyanese Householder Income Under 25 years
COMPARE
Irish
Guyanese
Householder Income Under 25 years
Householder Income Under 25 years Comparison
Irish
Guyanese
$51,317
HOUSEHOLDER INCOME UNDER 25 YEARS
10.6/ 100
METRIC RATING
211th/ 347
METRIC RANK
$55,210
HOUSEHOLDER INCOME UNDER 25 YEARS
99.9/ 100
METRIC RATING
58th/ 347
METRIC RANK
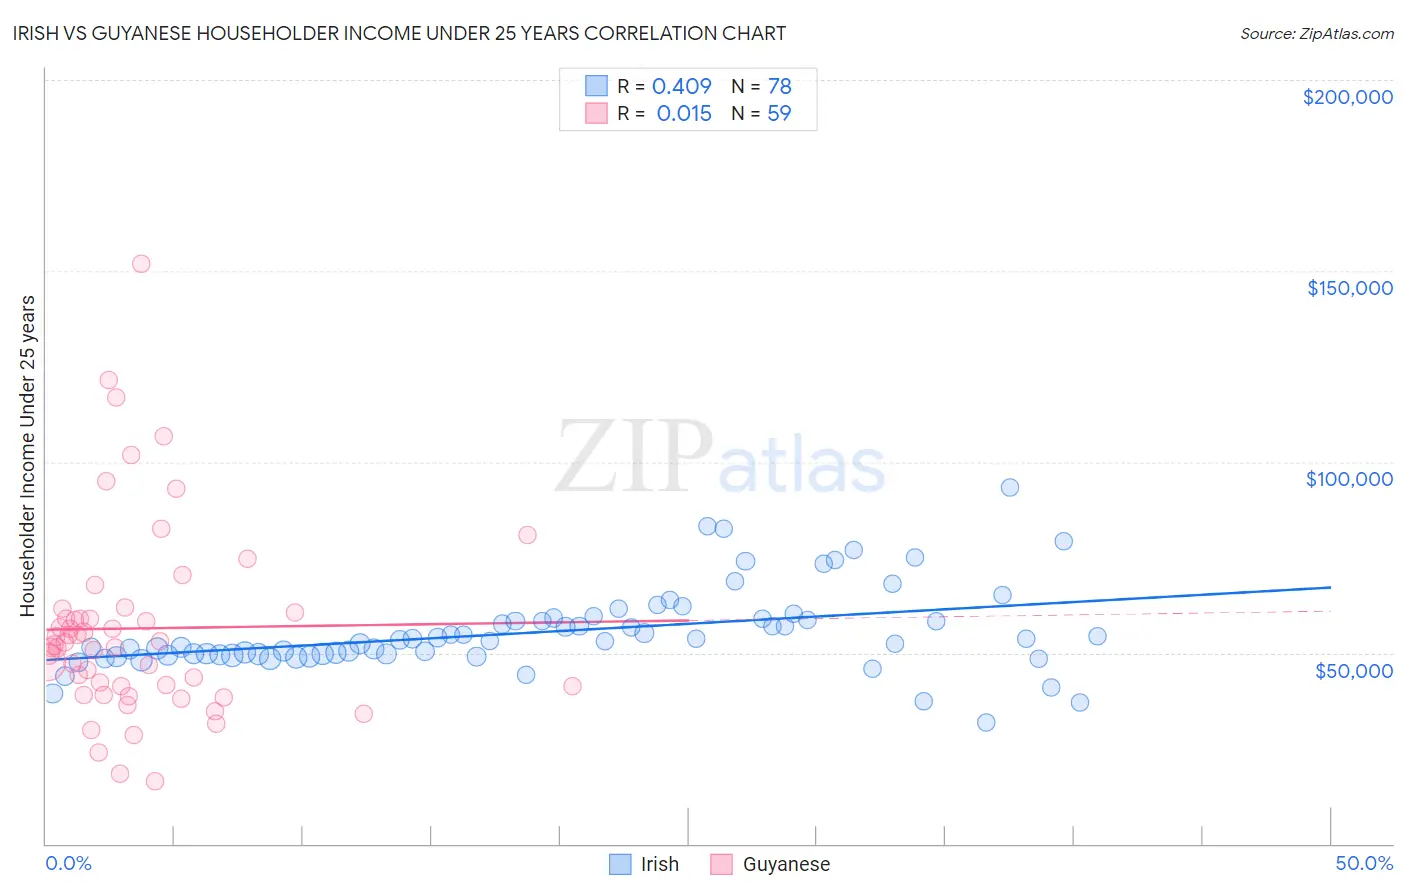
Irish vs Guyanese Householder Income Under 25 years Correlation Chart
The statistical analysis conducted on geographies consisting of 440,822,070 people shows a moderate positive correlation between the proportion of Irish and household income with householder under the age of 25 in the United States with a correlation coefficient (R) of 0.409 and weighted average of $51,317. Similarly, the statistical analysis conducted on geographies consisting of 154,823,107 people shows no correlation between the proportion of Guyanese and household income with householder under the age of 25 in the United States with a correlation coefficient (R) of 0.015 and weighted average of $55,210, a difference of 7.6%.
Householder Income Under 25 years Correlation Summary
| Measurement | Irish | Guyanese |
| Minimum | $31,667 | $16,250 |
| Maximum | $93,226 | $151,864 |
| Range | $61,559 | $135,614 |
| Mean | $55,607 | $56,409 |
| Median | $53,275 | $51,977 |
| Interquartile 25% (IQ1) | $49,439 | $41,119 |
| Interquartile 75% (IQ3) | $58,969 | $60,617 |
| Interquartile Range (IQR) | $9,530 | $19,498 |
| Standard Deviation (Sample) | $10,889 | $25,406 |
| Standard Deviation (Population) | $10,819 | $25,190 |
Similar Demographics by Householder Income Under 25 years
Demographics Similar to Irish by Householder Income Under 25 years
In terms of householder income under 25 years, the demographic groups most similar to Irish are Immigrants from Ghana ($51,333, a difference of 0.030%), Syrian ($51,353, a difference of 0.070%), Immigrants from Panama ($51,278, a difference of 0.080%), Immigrants from Jordan ($51,370, a difference of 0.10%), and Dutch ($51,265, a difference of 0.10%).
| Demographics | Rating | Rank | Householder Income Under 25 years |
| Czechs | 13.2 /100 | #204 | Poor $51,421 |
| Cape Verdeans | 12.3 /100 | #205 | Poor $51,387 |
| Immigrants | Latin America | 12.3 /100 | #206 | Poor $51,387 |
| South Africans | 12.2 /100 | #207 | Poor $51,383 |
| Immigrants | Jordan | 11.9 /100 | #208 | Poor $51,370 |
| Syrians | 11.4 /100 | #209 | Poor $51,353 |
| Immigrants | Ghana | 10.9 /100 | #210 | Poor $51,333 |
| Irish | 10.6 /100 | #211 | Poor $51,317 |
| Immigrants | Panama | 9.7 /100 | #212 | Tragic $51,278 |
| Dutch | 9.4 /100 | #213 | Tragic $51,265 |
| Zimbabweans | 9.3 /100 | #214 | Tragic $51,259 |
| Icelanders | 9.1 /100 | #215 | Tragic $51,247 |
| French | 8.7 /100 | #216 | Tragic $51,230 |
| Czechoslovakians | 8.6 /100 | #217 | Tragic $51,224 |
| Immigrants | Belize | 8.6 /100 | #218 | Tragic $51,223 |
Demographics Similar to Guyanese by Householder Income Under 25 years
In terms of householder income under 25 years, the demographic groups most similar to Guyanese are Native Hawaiian ($55,158, a difference of 0.090%), Soviet Union ($55,340, a difference of 0.24%), Immigrants from Lithuania ($55,028, a difference of 0.33%), Immigrants from Europe ($55,022, a difference of 0.34%), and Salvadoran ($55,412, a difference of 0.37%).
| Demographics | Rating | Rank | Householder Income Under 25 years |
| Immigrants | Romania | 100.0 /100 | #51 | Exceptional $55,522 |
| Immigrants | Indonesia | 100.0 /100 | #52 | Exceptional $55,521 |
| Immigrants | Poland | 100.0 /100 | #53 | Exceptional $55,474 |
| Sri Lankans | 100.0 /100 | #54 | Exceptional $55,470 |
| Immigrants | Ukraine | 100.0 /100 | #55 | Exceptional $55,447 |
| Salvadorans | 100.0 /100 | #56 | Exceptional $55,412 |
| Soviet Union | 100.0 /100 | #57 | Exceptional $55,340 |
| Guyanese | 99.9 /100 | #58 | Exceptional $55,210 |
| Native Hawaiians | 99.9 /100 | #59 | Exceptional $55,158 |
| Immigrants | Lithuania | 99.9 /100 | #60 | Exceptional $55,028 |
| Immigrants | Europe | 99.9 /100 | #61 | Exceptional $55,022 |
| Immigrants | Uzbekistan | 99.8 /100 | #62 | Exceptional $54,846 |
| Immigrants | Belgium | 99.8 /100 | #63 | Exceptional $54,830 |
| Burmese | 99.8 /100 | #64 | Exceptional $54,800 |
| Yup'ik | 99.8 /100 | #65 | Exceptional $54,732 |