Inupiat vs Immigrants from Dominica Unemployment Among Women with Children Under 18 years
COMPARE
Inupiat
Immigrants from Dominica
Unemployment Among Women with Children Under 18 years
Unemployment Among Women with Children Under 18 years Comparison
Inupiat
Immigrants from Dominica
9.6%
UNEMPLOYMENT AMONG WOMEN WITH CHILDREN UNDER 18 YEARS
0.0/ 100
METRIC RATING
344th/ 347
METRIC RANK
7.0%
UNEMPLOYMENT AMONG WOMEN WITH CHILDREN UNDER 18 YEARS
0.0/ 100
METRIC RATING
325th/ 347
METRIC RANK
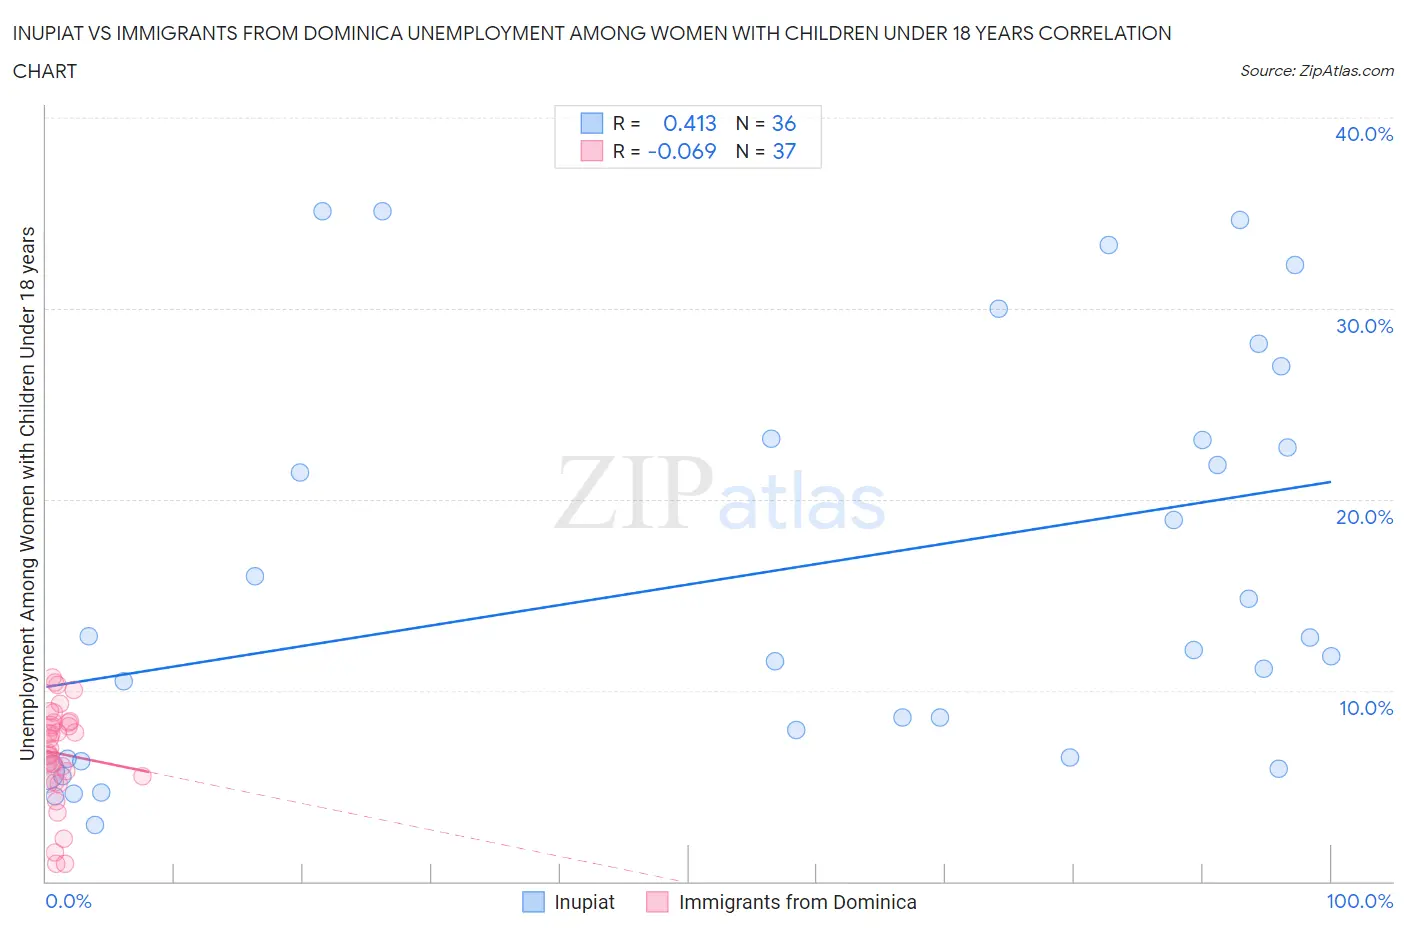
Inupiat vs Immigrants from Dominica Unemployment Among Women with Children Under 18 years Correlation Chart
The statistical analysis conducted on geographies consisting of 94,720,534 people shows a moderate positive correlation between the proportion of Inupiat and unemployment rate among women with children under the age of 18 in the United States with a correlation coefficient (R) of 0.413 and weighted average of 9.6%. Similarly, the statistical analysis conducted on geographies consisting of 83,263,955 people shows a slight negative correlation between the proportion of Immigrants from Dominica and unemployment rate among women with children under the age of 18 in the United States with a correlation coefficient (R) of -0.069 and weighted average of 7.0%, a difference of 37.4%.
Unemployment Among Women with Children Under 18 years Correlation Summary
| Measurement | Inupiat | Immigrants from Dominica |
| Minimum | 2.9% | 0.90% |
| Maximum | 35.1% | 10.7% |
| Range | 32.2% | 9.8% |
| Mean | 16.1% | 6.7% |
| Median | 12.4% | 6.9% |
| Interquartile 25% (IQ1) | 6.5% | 5.3% |
| Interquartile 75% (IQ3) | 23.1% | 8.3% |
| Interquartile Range (IQR) | 16.7% | 3.0% |
| Standard Deviation (Sample) | 10.4% | 2.5% |
| Standard Deviation (Population) | 10.3% | 2.5% |
Demographics Similar to Inupiat and Immigrants from Dominica by Unemployment Among Women with Children Under 18 years
In terms of unemployment among women with children under 18 years, the demographic groups most similar to Inupiat are Arapaho (9.2%, a difference of 4.2%), Puerto Rican (9.0%, a difference of 6.4%), Tohono O'odham (8.9%, a difference of 8.1%), Crow (8.2%, a difference of 16.2%), and Navajo (8.2%, a difference of 16.5%). Similarly, the demographic groups most similar to Immigrants from Dominica are Chippewa (7.0%, a difference of 0.71%), Paiute (6.9%, a difference of 1.2%), Lumbee (7.1%, a difference of 1.6%), Native/Alaskan (7.2%, a difference of 4.0%), and Black/African American (7.3%, a difference of 4.4%).
| Demographics | Rating | Rank | Unemployment Among Women with Children Under 18 years |
| Paiute | 0.0 /100 | #324 | Tragic 6.9% |
| Immigrants | Dominica | 0.0 /100 | #325 | Tragic 7.0% |
| Chippewa | 0.0 /100 | #326 | Tragic 7.0% |
| Lumbee | 0.0 /100 | #327 | Tragic 7.1% |
| Natives/Alaskans | 0.0 /100 | #328 | Tragic 7.2% |
| Blacks/African Americans | 0.0 /100 | #329 | Tragic 7.3% |
| Colville | 0.0 /100 | #330 | Tragic 7.4% |
| Hopi | 0.0 /100 | #331 | Tragic 7.4% |
| Dominicans | 0.0 /100 | #332 | Tragic 7.5% |
| Immigrants | Dominican Republic | 0.0 /100 | #333 | Tragic 7.5% |
| Cheyenne | 0.0 /100 | #334 | Tragic 7.8% |
| Apache | 0.0 /100 | #335 | Tragic 7.9% |
| Sioux | 0.0 /100 | #336 | Tragic 7.9% |
| Yakama | 0.0 /100 | #337 | Tragic 8.1% |
| Immigrants | Yemen | 0.0 /100 | #338 | Tragic 8.2% |
| Navajo | 0.0 /100 | #339 | Tragic 8.2% |
| Crow | 0.0 /100 | #340 | Tragic 8.2% |
| Tohono O'odham | 0.0 /100 | #341 | Tragic 8.9% |
| Puerto Ricans | 0.0 /100 | #342 | Tragic 9.0% |
| Arapaho | 0.0 /100 | #343 | Tragic 9.2% |
| Inupiat | 0.0 /100 | #344 | Tragic 9.6% |