Inupiat vs Cherokee Unemployment Among Ages 25 to 29 years
COMPARE
Inupiat
Cherokee
Unemployment Among Ages 25 to 29 years
Unemployment Among Ages 25 to 29 years Comparison
Inupiat
Cherokee
13.4%
UNEMPLOYMENT AMONG AGES 25 TO 29 YEARS
0.0/ 100
METRIC RATING
343rd/ 347
METRIC RANK
7.6%
UNEMPLOYMENT AMONG AGES 25 TO 29 YEARS
0.0/ 100
METRIC RATING
284th/ 347
METRIC RANK
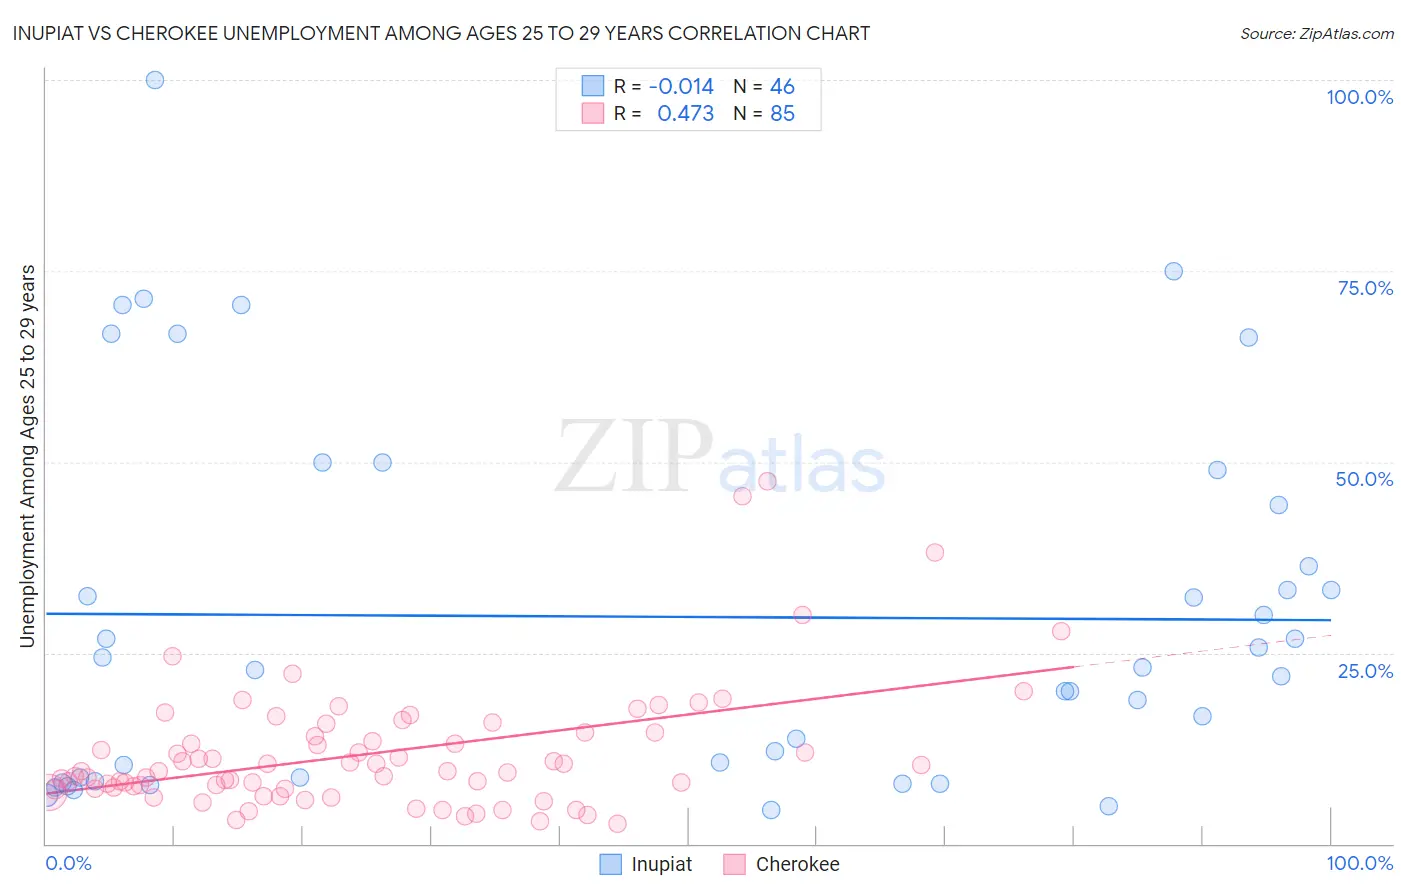
Inupiat vs Cherokee Unemployment Among Ages 25 to 29 years Correlation Chart
The statistical analysis conducted on geographies consisting of 94,919,463 people shows no correlation between the proportion of Inupiat and unemployment rate among population between the ages 25 and 29 in the United States with a correlation coefficient (R) of -0.014 and weighted average of 13.4%. Similarly, the statistical analysis conducted on geographies consisting of 454,121,490 people shows a moderate positive correlation between the proportion of Cherokee and unemployment rate among population between the ages 25 and 29 in the United States with a correlation coefficient (R) of 0.473 and weighted average of 7.6%, a difference of 77.3%.
Unemployment Among Ages 25 to 29 years Correlation Summary
| Measurement | Inupiat | Cherokee |
| Minimum | 4.5% | 2.7% |
| Maximum | 100.0% | 47.4% |
| Range | 95.5% | 44.7% |
| Mean | 29.7% | 11.9% |
| Median | 22.9% | 9.5% |
| Interquartile 25% (IQ1) | 8.6% | 7.3% |
| Interquartile 75% (IQ3) | 44.4% | 14.6% |
| Interquartile Range (IQR) | 35.8% | 7.3% |
| Standard Deviation (Sample) | 24.1% | 8.3% |
| Standard Deviation (Population) | 23.9% | 8.2% |
Similar Demographics by Unemployment Among Ages 25 to 29 years
Demographics Similar to Inupiat by Unemployment Among Ages 25 to 29 years
In terms of unemployment among ages 25 to 29 years, the demographic groups most similar to Inupiat are Hopi (13.5%, a difference of 0.65%), Navajo (12.2%, a difference of 10.3%), Tohono O'odham (12.1%, a difference of 11.2%), Cheyenne (11.8%, a difference of 13.5%), and Pima (11.8%, a difference of 14.0%).
| Demographics | Rating | Rank | Unemployment Among Ages 25 to 29 years |
| Alaskan Athabascans | 0.0 /100 | #333 | Tragic 10.8% |
| Yuman | 0.0 /100 | #334 | Tragic 11.0% |
| Puerto Ricans | 0.0 /100 | #335 | Tragic 11.1% |
| Lumbee | 0.0 /100 | #336 | Tragic 11.2% |
| Menominee | 0.0 /100 | #337 | Tragic 11.3% |
| Sioux | 0.0 /100 | #338 | Tragic 11.7% |
| Pima | 0.0 /100 | #339 | Tragic 11.8% |
| Cheyenne | 0.0 /100 | #340 | Tragic 11.8% |
| Tohono O'odham | 0.0 /100 | #341 | Tragic 12.1% |
| Navajo | 0.0 /100 | #342 | Tragic 12.2% |
| Inupiat | 0.0 /100 | #343 | Tragic 13.4% |
| Hopi | 0.0 /100 | #344 | Tragic 13.5% |
| Arapaho | 0.0 /100 | #345 | Tragic 15.4% |
| Crow | 0.0 /100 | #346 | Tragic 15.4% |
| Yup'ik | 0.0 /100 | #347 | Tragic 17.9% |
Demographics Similar to Cherokee by Unemployment Among Ages 25 to 29 years
In terms of unemployment among ages 25 to 29 years, the demographic groups most similar to Cherokee are Creek (7.6%, a difference of 0.010%), Senegalese (7.6%, a difference of 0.12%), Immigrants from Senegal (7.6%, a difference of 0.18%), Vietnamese (7.6%, a difference of 0.21%), and Immigrants from Bangladesh (7.5%, a difference of 0.35%).
| Demographics | Rating | Rank | Unemployment Among Ages 25 to 29 years |
| Iroquois | 0.0 /100 | #277 | Tragic 7.5% |
| Mexicans | 0.0 /100 | #278 | Tragic 7.5% |
| Nepalese | 0.0 /100 | #279 | Tragic 7.5% |
| Immigrants | Caribbean | 0.0 /100 | #280 | Tragic 7.5% |
| Immigrants | Bangladesh | 0.0 /100 | #281 | Tragic 7.5% |
| Immigrants | Senegal | 0.0 /100 | #282 | Tragic 7.6% |
| Creek | 0.0 /100 | #283 | Tragic 7.6% |
| Cherokee | 0.0 /100 | #284 | Tragic 7.6% |
| Senegalese | 0.0 /100 | #285 | Tragic 7.6% |
| Vietnamese | 0.0 /100 | #286 | Tragic 7.6% |
| Immigrants | Mexico | 0.0 /100 | #287 | Tragic 7.6% |
| Africans | 0.0 /100 | #288 | Tragic 7.6% |
| Belizeans | 0.0 /100 | #289 | Tragic 7.7% |
| Armenians | 0.0 /100 | #290 | Tragic 7.7% |
| Hispanics or Latinos | 0.0 /100 | #291 | Tragic 7.7% |