Indonesian vs Seminole Unemployment
COMPARE
Indonesian
Seminole
Unemployment
Unemployment Comparison
Indonesians
Seminole
5.1%
UNEMPLOYMENT
82.3/ 100
METRIC RATING
144th/ 347
METRIC RANK
5.4%
UNEMPLOYMENT
9.2/ 100
METRIC RATING
223rd/ 347
METRIC RANK
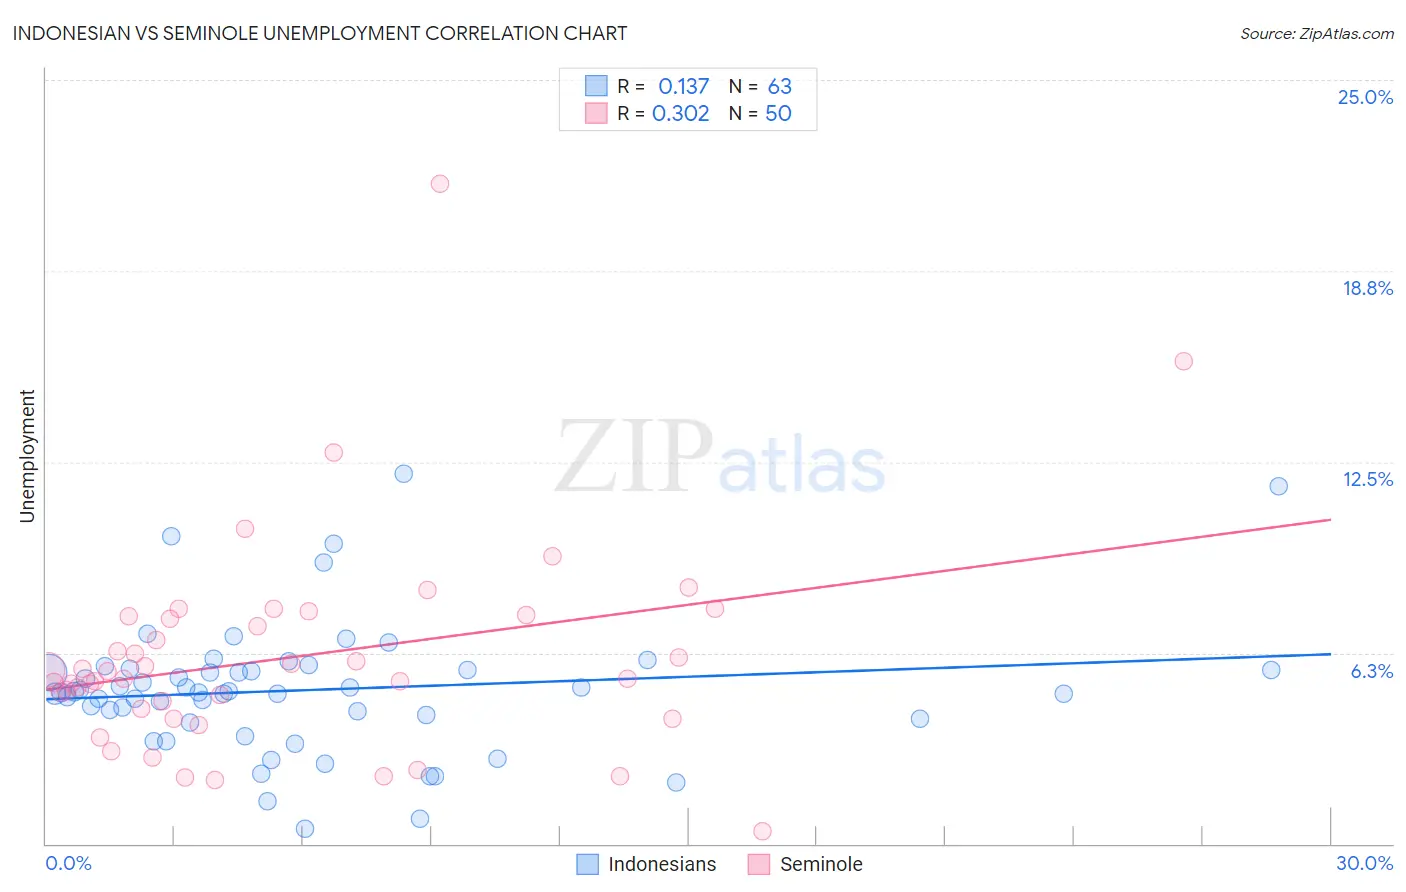
Indonesian vs Seminole Unemployment Correlation Chart
The statistical analysis conducted on geographies consisting of 162,697,031 people shows a poor positive correlation between the proportion of Indonesians and unemployment in the United States with a correlation coefficient (R) of 0.137 and weighted average of 5.1%. Similarly, the statistical analysis conducted on geographies consisting of 118,261,058 people shows a mild positive correlation between the proportion of Seminole and unemployment in the United States with a correlation coefficient (R) of 0.302 and weighted average of 5.4%, a difference of 6.0%.
Unemployment Correlation Summary
| Measurement | Indonesian | Seminole |
| Minimum | 0.50% | 0.40% |
| Maximum | 12.1% | 21.6% |
| Range | 11.6% | 21.2% |
| Mean | 5.0% | 6.1% |
| Median | 5.0% | 5.5% |
| Interquartile 25% (IQ1) | 4.1% | 4.4% |
| Interquartile 75% (IQ3) | 5.7% | 7.4% |
| Interquartile Range (IQR) | 1.6% | 3.0% |
| Standard Deviation (Sample) | 2.2% | 3.5% |
| Standard Deviation (Population) | 2.2% | 3.5% |
Similar Demographics by Unemployment
Demographics Similar to Indonesians by Unemployment
In terms of unemployment, the demographic groups most similar to Indonesians are Immigrants from Chile (5.1%, a difference of 0.050%), Immigrants from Norway (5.1%, a difference of 0.050%), Immigrants from Asia (5.1%, a difference of 0.060%), Indian (Asian) (5.1%, a difference of 0.070%), and Immigrants from Pakistan (5.1%, a difference of 0.10%).
| Demographics | Rating | Rank | Unemployment |
| Immigrants | Saudi Arabia | 85.6 /100 | #137 | Excellent 5.1% |
| Immigrants | Hungary | 85.6 /100 | #138 | Excellent 5.1% |
| Pakistanis | 85.3 /100 | #139 | Excellent 5.1% |
| Immigrants | Denmark | 84.3 /100 | #140 | Excellent 5.1% |
| Palestinians | 83.4 /100 | #141 | Excellent 5.1% |
| Immigrants | Pakistan | 83.2 /100 | #142 | Excellent 5.1% |
| Immigrants | Chile | 82.8 /100 | #143 | Excellent 5.1% |
| Indonesians | 82.3 /100 | #144 | Excellent 5.1% |
| Immigrants | Norway | 81.8 /100 | #145 | Excellent 5.1% |
| Immigrants | Asia | 81.8 /100 | #146 | Excellent 5.1% |
| Indians (Asian) | 81.6 /100 | #147 | Excellent 5.1% |
| Immigrants | Italy | 79.1 /100 | #148 | Good 5.1% |
| Syrians | 77.7 /100 | #149 | Good 5.2% |
| Potawatomi | 76.2 /100 | #150 | Good 5.2% |
| Immigrants | Eastern Europe | 75.3 /100 | #151 | Good 5.2% |
Demographics Similar to Seminole by Unemployment
In terms of unemployment, the demographic groups most similar to Seminole are Israeli (5.4%, a difference of 0.070%), Iroquois (5.4%, a difference of 0.18%), Immigrants from Philippines (5.4%, a difference of 0.21%), Soviet Union (5.4%, a difference of 0.25%), and South American Indian (5.5%, a difference of 0.27%).
| Demographics | Rating | Rank | Unemployment |
| Immigrants | South America | 13.5 /100 | #216 | Poor 5.4% |
| Immigrants | Albania | 13.5 /100 | #217 | Poor 5.4% |
| Choctaw | 12.7 /100 | #218 | Poor 5.4% |
| Bangladeshis | 11.2 /100 | #219 | Poor 5.4% |
| Soviet Union | 10.6 /100 | #220 | Poor 5.4% |
| Immigrants | Philippines | 10.4 /100 | #221 | Poor 5.4% |
| Iroquois | 10.3 /100 | #222 | Poor 5.4% |
| Seminole | 9.2 /100 | #223 | Tragic 5.4% |
| Israelis | 8.8 /100 | #224 | Tragic 5.4% |
| South American Indians | 7.8 /100 | #225 | Tragic 5.5% |
| Samoans | 7.1 /100 | #226 | Tragic 5.5% |
| Immigrants | Lebanon | 7.0 /100 | #227 | Tragic 5.5% |
| Guamanians/Chamorros | 6.3 /100 | #228 | Tragic 5.5% |
| Hawaiians | 5.4 /100 | #229 | Tragic 5.5% |
| Ottawa | 5.4 /100 | #230 | Tragic 5.5% |