Indonesian vs Tlingit-Haida Unemployment
COMPARE
Indonesian
Tlingit-Haida
Unemployment
Unemployment Comparison
Indonesians
Tlingit-Haida
5.1%
UNEMPLOYMENT
82.3/ 100
METRIC RATING
144th/ 347
METRIC RANK
5.6%
UNEMPLOYMENT
2.0/ 100
METRIC RATING
241st/ 347
METRIC RANK
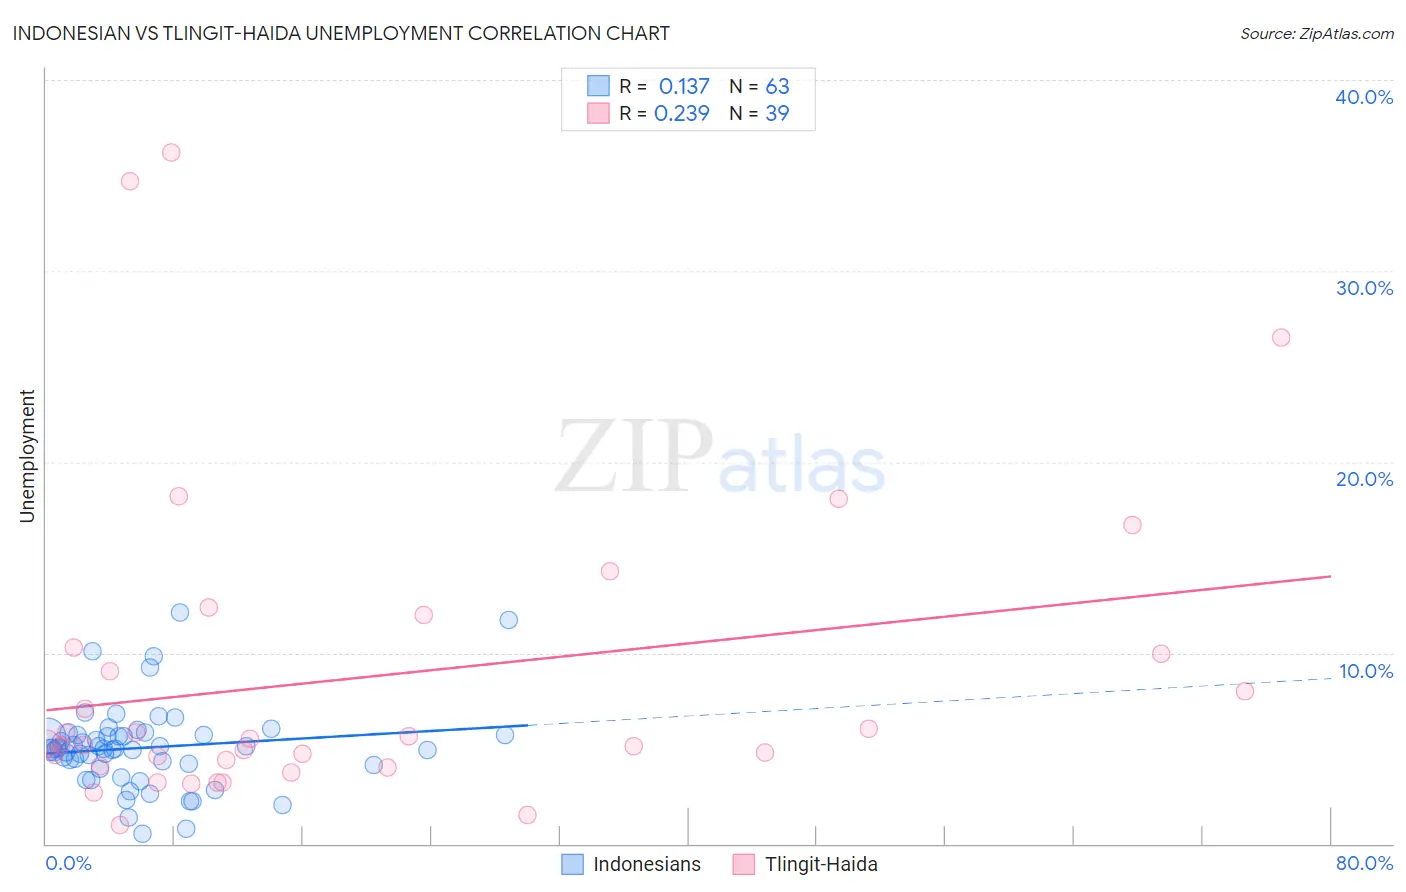
Indonesian vs Tlingit-Haida Unemployment Correlation Chart
The statistical analysis conducted on geographies consisting of 162,697,031 people shows a poor positive correlation between the proportion of Indonesians and unemployment in the United States with a correlation coefficient (R) of 0.137 and weighted average of 5.1%. Similarly, the statistical analysis conducted on geographies consisting of 60,829,172 people shows a weak positive correlation between the proportion of Tlingit-Haida and unemployment in the United States with a correlation coefficient (R) of 0.239 and weighted average of 5.6%, a difference of 8.5%.
Unemployment Correlation Summary
| Measurement | Indonesian | Tlingit-Haida |
| Minimum | 0.50% | 1.0% |
| Maximum | 12.1% | 36.2% |
| Range | 11.6% | 35.2% |
| Mean | 5.0% | 8.7% |
| Median | 5.0% | 5.2% |
| Interquartile 25% (IQ1) | 4.1% | 4.0% |
| Interquartile 75% (IQ3) | 5.7% | 10.3% |
| Interquartile Range (IQR) | 1.6% | 6.3% |
| Standard Deviation (Sample) | 2.2% | 8.2% |
| Standard Deviation (Population) | 2.2% | 8.1% |
Similar Demographics by Unemployment
Demographics Similar to Indonesians by Unemployment
In terms of unemployment, the demographic groups most similar to Indonesians are Immigrants from Chile (5.1%, a difference of 0.050%), Immigrants from Norway (5.1%, a difference of 0.050%), Immigrants from Asia (5.1%, a difference of 0.060%), Indian (Asian) (5.1%, a difference of 0.070%), and Immigrants from Pakistan (5.1%, a difference of 0.10%).
| Demographics | Rating | Rank | Unemployment |
| Immigrants | Saudi Arabia | 85.6 /100 | #137 | Excellent 5.1% |
| Immigrants | Hungary | 85.6 /100 | #138 | Excellent 5.1% |
| Pakistanis | 85.3 /100 | #139 | Excellent 5.1% |
| Immigrants | Denmark | 84.3 /100 | #140 | Excellent 5.1% |
| Palestinians | 83.4 /100 | #141 | Excellent 5.1% |
| Immigrants | Pakistan | 83.2 /100 | #142 | Excellent 5.1% |
| Immigrants | Chile | 82.8 /100 | #143 | Excellent 5.1% |
| Indonesians | 82.3 /100 | #144 | Excellent 5.1% |
| Immigrants | Norway | 81.8 /100 | #145 | Excellent 5.1% |
| Immigrants | Asia | 81.8 /100 | #146 | Excellent 5.1% |
| Indians (Asian) | 81.6 /100 | #147 | Excellent 5.1% |
| Immigrants | Italy | 79.1 /100 | #148 | Good 5.1% |
| Syrians | 77.7 /100 | #149 | Good 5.2% |
| Potawatomi | 76.2 /100 | #150 | Good 5.2% |
| Immigrants | Eastern Europe | 75.3 /100 | #151 | Good 5.2% |
Demographics Similar to Tlingit-Haida by Unemployment
In terms of unemployment, the demographic groups most similar to Tlingit-Haida are Spanish American (5.6%, a difference of 0.0%), Cree (5.6%, a difference of 0.34%), Immigrants (5.5%, a difference of 0.35%), Immigrants from Western Asia (5.5%, a difference of 0.44%), and Marshallese (5.6%, a difference of 0.64%).
| Demographics | Rating | Rank | Unemployment |
| Panamanians | 4.7 /100 | #234 | Tragic 5.5% |
| Immigrants | Panama | 3.4 /100 | #235 | Tragic 5.5% |
| Immigrants | Cambodia | 3.3 /100 | #236 | Tragic 5.5% |
| Moroccans | 3.2 /100 | #237 | Tragic 5.5% |
| Immigrants | Western Asia | 2.8 /100 | #238 | Tragic 5.5% |
| Immigrants | Immigrants | 2.6 /100 | #239 | Tragic 5.5% |
| Cree | 2.6 /100 | #240 | Tragic 5.6% |
| Tlingit-Haida | 2.0 /100 | #241 | Tragic 5.6% |
| Spanish Americans | 2.0 /100 | #242 | Tragic 5.6% |
| Marshallese | 1.3 /100 | #243 | Tragic 5.6% |
| Dutch West Indians | 1.2 /100 | #244 | Tragic 5.6% |
| French American Indians | 1.2 /100 | #245 | Tragic 5.6% |
| Bermudans | 1.1 /100 | #246 | Tragic 5.6% |
| Immigrants | Cameroon | 1.0 /100 | #247 | Tragic 5.6% |
| Liberians | 0.9 /100 | #248 | Tragic 5.6% |