Immigrants from Zimbabwe vs Seminole Unemployment
COMPARE
Immigrants from Zimbabwe
Seminole
Unemployment
Unemployment Comparison
Immigrants from Zimbabwe
Seminole
4.9%
UNEMPLOYMENT
99.2/ 100
METRIC RATING
53rd/ 347
METRIC RANK
5.4%
UNEMPLOYMENT
9.2/ 100
METRIC RATING
223rd/ 347
METRIC RANK
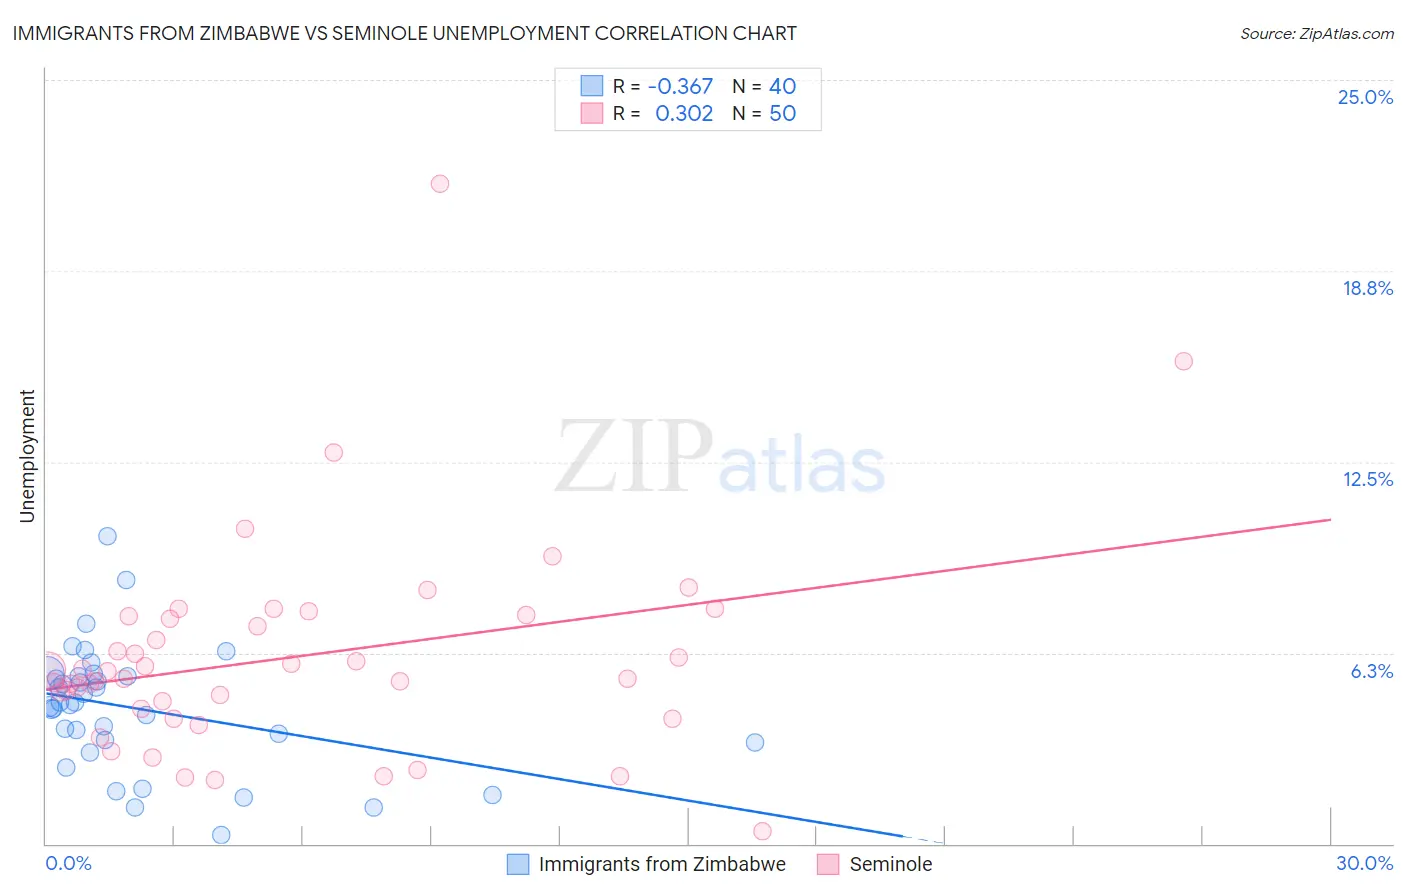
Immigrants from Zimbabwe vs Seminole Unemployment Correlation Chart
The statistical analysis conducted on geographies consisting of 117,788,083 people shows a mild negative correlation between the proportion of Immigrants from Zimbabwe and unemployment in the United States with a correlation coefficient (R) of -0.367 and weighted average of 4.9%. Similarly, the statistical analysis conducted on geographies consisting of 118,261,058 people shows a mild positive correlation between the proportion of Seminole and unemployment in the United States with a correlation coefficient (R) of 0.302 and weighted average of 5.4%, a difference of 11.8%.
Unemployment Correlation Summary
| Measurement | Immigrants from Zimbabwe | Seminole |
| Minimum | 0.30% | 0.40% |
| Maximum | 10.1% | 21.6% |
| Range | 9.8% | 21.2% |
| Mean | 4.4% | 6.1% |
| Median | 4.6% | 5.5% |
| Interquartile 25% (IQ1) | 3.4% | 4.4% |
| Interquartile 75% (IQ3) | 5.5% | 7.4% |
| Interquartile Range (IQR) | 2.1% | 3.0% |
| Standard Deviation (Sample) | 2.0% | 3.5% |
| Standard Deviation (Population) | 2.0% | 3.5% |
Similar Demographics by Unemployment
Demographics Similar to Immigrants from Zimbabwe by Unemployment
In terms of unemployment, the demographic groups most similar to Immigrants from Zimbabwe are White/Caucasian (4.9%, a difference of 0.030%), Eastern European (4.9%, a difference of 0.030%), Immigrants from Belgium (4.9%, a difference of 0.040%), Australian (4.9%, a difference of 0.060%), and French Canadian (4.9%, a difference of 0.20%).
| Demographics | Rating | Rank | Unemployment |
| Immigrants | Nepal | 99.4 /100 | #46 | Exceptional 4.8% |
| Immigrants | Taiwan | 99.4 /100 | #47 | Exceptional 4.8% |
| Immigrants | Scotland | 99.3 /100 | #48 | Exceptional 4.9% |
| Immigrants | South Central Asia | 99.3 /100 | #49 | Exceptional 4.9% |
| French Canadians | 99.3 /100 | #50 | Exceptional 4.9% |
| Immigrants | Belgium | 99.2 /100 | #51 | Exceptional 4.9% |
| Whites/Caucasians | 99.2 /100 | #52 | Exceptional 4.9% |
| Immigrants | Zimbabwe | 99.2 /100 | #53 | Exceptional 4.9% |
| Eastern Europeans | 99.2 /100 | #54 | Exceptional 4.9% |
| Australians | 99.2 /100 | #55 | Exceptional 4.9% |
| Celtics | 99.1 /100 | #56 | Exceptional 4.9% |
| Immigrants | Singapore | 99.1 /100 | #57 | Exceptional 4.9% |
| Greeks | 99.0 /100 | #58 | Exceptional 4.9% |
| Bhutanese | 99.0 /100 | #59 | Exceptional 4.9% |
| Immigrants | Netherlands | 99.0 /100 | #60 | Exceptional 4.9% |
Demographics Similar to Seminole by Unemployment
In terms of unemployment, the demographic groups most similar to Seminole are Israeli (5.4%, a difference of 0.070%), Iroquois (5.4%, a difference of 0.18%), Immigrants from Philippines (5.4%, a difference of 0.21%), Soviet Union (5.4%, a difference of 0.25%), and South American Indian (5.5%, a difference of 0.27%).
| Demographics | Rating | Rank | Unemployment |
| Immigrants | South America | 13.5 /100 | #216 | Poor 5.4% |
| Immigrants | Albania | 13.5 /100 | #217 | Poor 5.4% |
| Choctaw | 12.7 /100 | #218 | Poor 5.4% |
| Bangladeshis | 11.2 /100 | #219 | Poor 5.4% |
| Soviet Union | 10.6 /100 | #220 | Poor 5.4% |
| Immigrants | Philippines | 10.4 /100 | #221 | Poor 5.4% |
| Iroquois | 10.3 /100 | #222 | Poor 5.4% |
| Seminole | 9.2 /100 | #223 | Tragic 5.4% |
| Israelis | 8.8 /100 | #224 | Tragic 5.4% |
| South American Indians | 7.8 /100 | #225 | Tragic 5.5% |
| Samoans | 7.1 /100 | #226 | Tragic 5.5% |
| Immigrants | Lebanon | 7.0 /100 | #227 | Tragic 5.5% |
| Guamanians/Chamorros | 6.3 /100 | #228 | Tragic 5.5% |
| Hawaiians | 5.4 /100 | #229 | Tragic 5.5% |
| Ottawa | 5.4 /100 | #230 | Tragic 5.5% |