Indonesian vs Immigrants from Oceania Unemployment
COMPARE
Indonesian
Immigrants from Oceania
Unemployment
Unemployment Comparison
Indonesians
Immigrants from Oceania
5.1%
UNEMPLOYMENT
82.3/ 100
METRIC RATING
144th/ 347
METRIC RANK
5.2%
UNEMPLOYMENT
65.2/ 100
METRIC RATING
161st/ 347
METRIC RANK
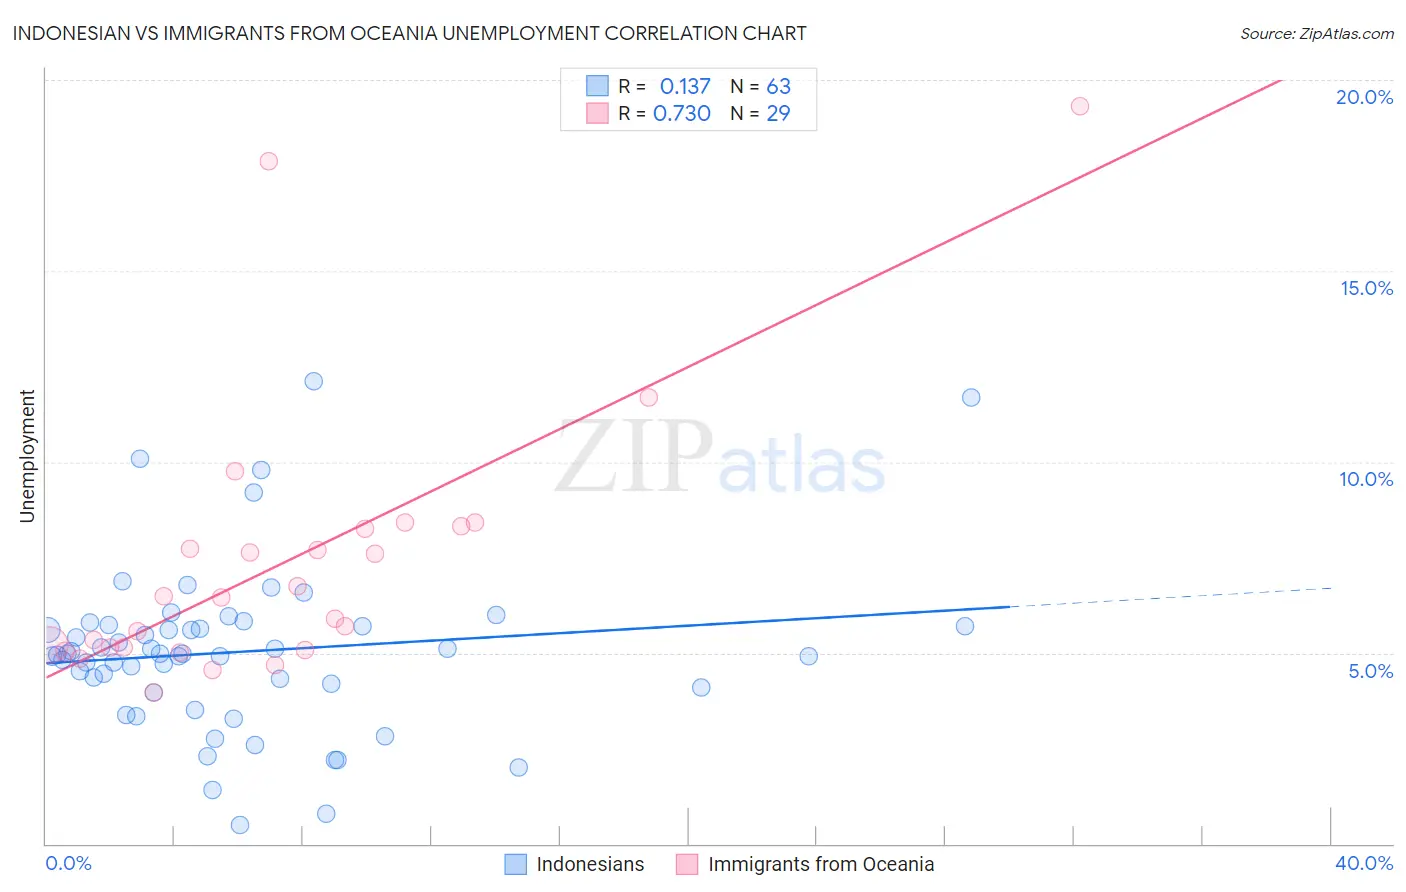
Indonesian vs Immigrants from Oceania Unemployment Correlation Chart
The statistical analysis conducted on geographies consisting of 162,697,031 people shows a poor positive correlation between the proportion of Indonesians and unemployment in the United States with a correlation coefficient (R) of 0.137 and weighted average of 5.1%. Similarly, the statistical analysis conducted on geographies consisting of 305,291,024 people shows a strong positive correlation between the proportion of Immigrants from Oceania and unemployment in the United States with a correlation coefficient (R) of 0.730 and weighted average of 5.2%, a difference of 1.4%.
Unemployment Correlation Summary
| Measurement | Indonesian | Immigrants from Oceania |
| Minimum | 0.50% | 4.0% |
| Maximum | 12.1% | 19.3% |
| Range | 11.6% | 15.3% |
| Mean | 5.0% | 7.4% |
| Median | 5.0% | 6.4% |
| Interquartile 25% (IQ1) | 4.1% | 5.1% |
| Interquartile 75% (IQ3) | 5.7% | 8.3% |
| Interquartile Range (IQR) | 1.6% | 3.2% |
| Standard Deviation (Sample) | 2.2% | 3.6% |
| Standard Deviation (Population) | 2.2% | 3.5% |
Demographics Similar to Indonesians and Immigrants from Oceania by Unemployment
In terms of unemployment, the demographic groups most similar to Indonesians are Immigrants from Chile (5.1%, a difference of 0.050%), Immigrants from Norway (5.1%, a difference of 0.050%), Immigrants from Asia (5.1%, a difference of 0.060%), Indian (Asian) (5.1%, a difference of 0.070%), and Immigrants from Pakistan (5.1%, a difference of 0.10%). Similarly, the demographic groups most similar to Immigrants from Oceania are Spanish (5.2%, a difference of 0.010%), Laotian (5.2%, a difference of 0.080%), Immigrants from Egypt (5.2%, a difference of 0.10%), Immigrants from Russia (5.2%, a difference of 0.10%), and Sri Lankan (5.2%, a difference of 0.30%).
| Demographics | Rating | Rank | Unemployment |
| Immigrants | Pakistan | 83.2 /100 | #142 | Excellent 5.1% |
| Immigrants | Chile | 82.8 /100 | #143 | Excellent 5.1% |
| Indonesians | 82.3 /100 | #144 | Excellent 5.1% |
| Immigrants | Norway | 81.8 /100 | #145 | Excellent 5.1% |
| Immigrants | Asia | 81.8 /100 | #146 | Excellent 5.1% |
| Indians (Asian) | 81.6 /100 | #147 | Excellent 5.1% |
| Immigrants | Italy | 79.1 /100 | #148 | Good 5.1% |
| Syrians | 77.7 /100 | #149 | Good 5.2% |
| Potawatomi | 76.2 /100 | #150 | Good 5.2% |
| Immigrants | Eastern Europe | 75.3 /100 | #151 | Good 5.2% |
| Immigrants | Hong Kong | 75.2 /100 | #152 | Good 5.2% |
| Egyptians | 75.2 /100 | #153 | Good 5.2% |
| Immigrants | China | 74.7 /100 | #154 | Good 5.2% |
| Immigrants | Northern Africa | 71.3 /100 | #155 | Good 5.2% |
| Immigrants | Kazakhstan | 70.4 /100 | #156 | Good 5.2% |
| Sri Lankans | 69.5 /100 | #157 | Good 5.2% |
| Immigrants | Egypt | 66.7 /100 | #158 | Good 5.2% |
| Immigrants | Russia | 66.6 /100 | #159 | Good 5.2% |
| Laotians | 66.3 /100 | #160 | Good 5.2% |
| Immigrants | Oceania | 65.2 /100 | #161 | Good 5.2% |
| Spanish | 65.1 /100 | #162 | Good 5.2% |