Indonesian vs Immigrants from Iraq Female Unemployment
COMPARE
Indonesian
Immigrants from Iraq
Female Unemployment
Female Unemployment Comparison
Indonesians
Immigrants from Iraq
5.0%
FEMALE UNEMPLOYMENT
95.1/ 100
METRIC RATING
100th/ 347
METRIC RANK
5.5%
FEMALE UNEMPLOYMENT
3.9/ 100
METRIC RATING
231st/ 347
METRIC RANK
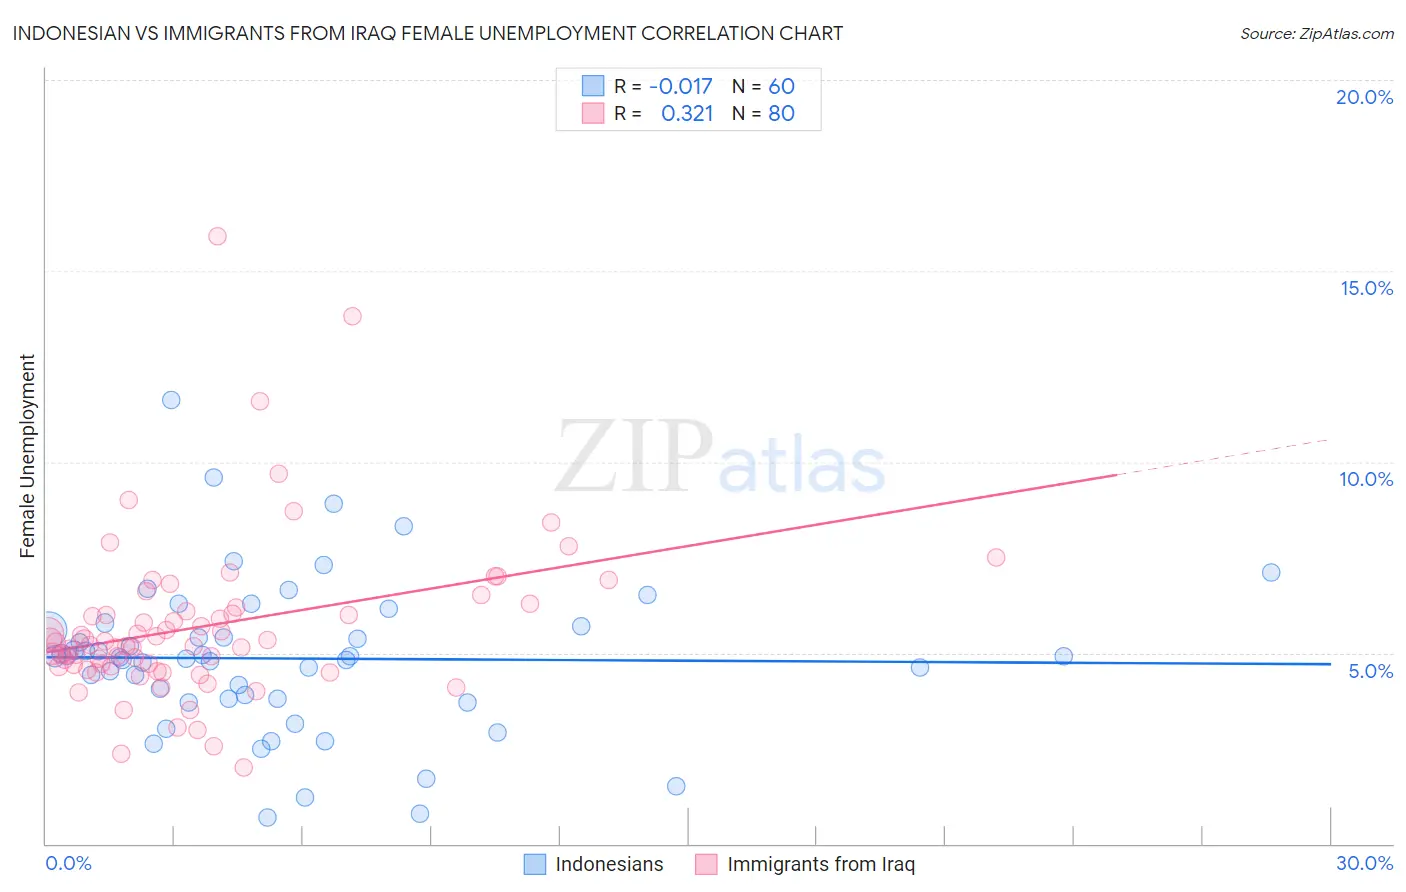
Indonesian vs Immigrants from Iraq Female Unemployment Correlation Chart
The statistical analysis conducted on geographies consisting of 162,464,387 people shows no correlation between the proportion of Indonesians and unemploymnet rate among females in the United States with a correlation coefficient (R) of -0.017 and weighted average of 5.0%. Similarly, the statistical analysis conducted on geographies consisting of 194,592,828 people shows a mild positive correlation between the proportion of Immigrants from Iraq and unemploymnet rate among females in the United States with a correlation coefficient (R) of 0.321 and weighted average of 5.5%, a difference of 9.7%.
Female Unemployment Correlation Summary
| Measurement | Indonesian | Immigrants from Iraq |
| Minimum | 0.70% | 2.0% |
| Maximum | 11.6% | 15.9% |
| Range | 10.9% | 13.9% |
| Mean | 4.9% | 5.7% |
| Median | 4.9% | 5.2% |
| Interquartile 25% (IQ1) | 3.8% | 4.7% |
| Interquartile 75% (IQ3) | 5.6% | 6.1% |
| Interquartile Range (IQR) | 1.9% | 1.5% |
| Standard Deviation (Sample) | 2.0% | 2.2% |
| Standard Deviation (Population) | 2.0% | 2.1% |
Similar Demographics by Female Unemployment
Demographics Similar to Indonesians by Female Unemployment
In terms of female unemployment, the demographic groups most similar to Indonesians are Immigrants from Zaire (5.0%, a difference of 0.020%), Immigrants from Somalia (5.0%, a difference of 0.030%), Immigrants from Kuwait (5.0%, a difference of 0.030%), Immigrants from Czechoslovakia (5.0%, a difference of 0.040%), and Immigrants from Kenya (5.0%, a difference of 0.10%).
| Demographics | Rating | Rank | Female Unemployment |
| Immigrants | Austria | 95.7 /100 | #93 | Exceptional 5.0% |
| Immigrants | Malaysia | 95.7 /100 | #94 | Exceptional 5.0% |
| Burmese | 95.6 /100 | #95 | Exceptional 5.0% |
| Immigrants | South Central Asia | 95.5 /100 | #96 | Exceptional 5.0% |
| Immigrants | Somalia | 95.2 /100 | #97 | Exceptional 5.0% |
| Immigrants | Kuwait | 95.2 /100 | #98 | Exceptional 5.0% |
| Immigrants | Zaire | 95.2 /100 | #99 | Exceptional 5.0% |
| Indonesians | 95.1 /100 | #100 | Exceptional 5.0% |
| Immigrants | Czechoslovakia | 95.0 /100 | #101 | Exceptional 5.0% |
| Immigrants | Kenya | 94.8 /100 | #102 | Exceptional 5.0% |
| Somalis | 94.6 /100 | #103 | Exceptional 5.0% |
| Kenyans | 93.7 /100 | #104 | Exceptional 5.0% |
| Immigrants | England | 93.6 /100 | #105 | Exceptional 5.0% |
| Paraguayans | 93.2 /100 | #106 | Exceptional 5.1% |
| Immigrants | Switzerland | 93.1 /100 | #107 | Exceptional 5.1% |
Demographics Similar to Immigrants from Iraq by Female Unemployment
In terms of female unemployment, the demographic groups most similar to Immigrants from Iraq are Liberian (5.5%, a difference of 0.010%), Moroccan (5.5%, a difference of 0.21%), Immigrants from Lebanon (5.5%, a difference of 0.24%), Immigrants from Iran (5.5%, a difference of 0.24%), and Immigrants from Uruguay (5.5%, a difference of 0.27%).
| Demographics | Rating | Rank | Female Unemployment |
| Iraqis | 7.1 /100 | #224 | Tragic 5.5% |
| French American Indians | 6.1 /100 | #225 | Tragic 5.5% |
| Immigrants | Peru | 5.9 /100 | #226 | Tragic 5.5% |
| Immigrants | Philippines | 5.3 /100 | #227 | Tragic 5.5% |
| Israelis | 4.8 /100 | #228 | Tragic 5.5% |
| Panamanians | 4.7 /100 | #229 | Tragic 5.5% |
| Immigrants | Uruguay | 4.7 /100 | #230 | Tragic 5.5% |
| Immigrants | Iraq | 3.9 /100 | #231 | Tragic 5.5% |
| Liberians | 3.9 /100 | #232 | Tragic 5.5% |
| Moroccans | 3.4 /100 | #233 | Tragic 5.5% |
| Immigrants | Lebanon | 3.3 /100 | #234 | Tragic 5.5% |
| Immigrants | Iran | 3.3 /100 | #235 | Tragic 5.5% |
| Immigrants | Cambodia | 3.3 /100 | #236 | Tragic 5.5% |
| Immigrants | Panama | 3.2 /100 | #237 | Tragic 5.5% |
| Sierra Leoneans | 3.2 /100 | #238 | Tragic 5.5% |