Immigrants from Morocco vs Immigrants from Vietnam Unemployment Among Ages 30 to 34 years
COMPARE
Immigrants from Morocco
Immigrants from Vietnam
Unemployment Among Ages 30 to 34 years
Unemployment Among Ages 30 to 34 years Comparison
Immigrants from Morocco
Immigrants from Vietnam
5.1%
UNEMPLOYMENT AMONG AGES 30 TO 34 YEARS
97.9/ 100
METRIC RATING
54th/ 347
METRIC RANK
5.0%
UNEMPLOYMENT AMONG AGES 30 TO 34 YEARS
98.9/ 100
METRIC RATING
40th/ 347
METRIC RANK
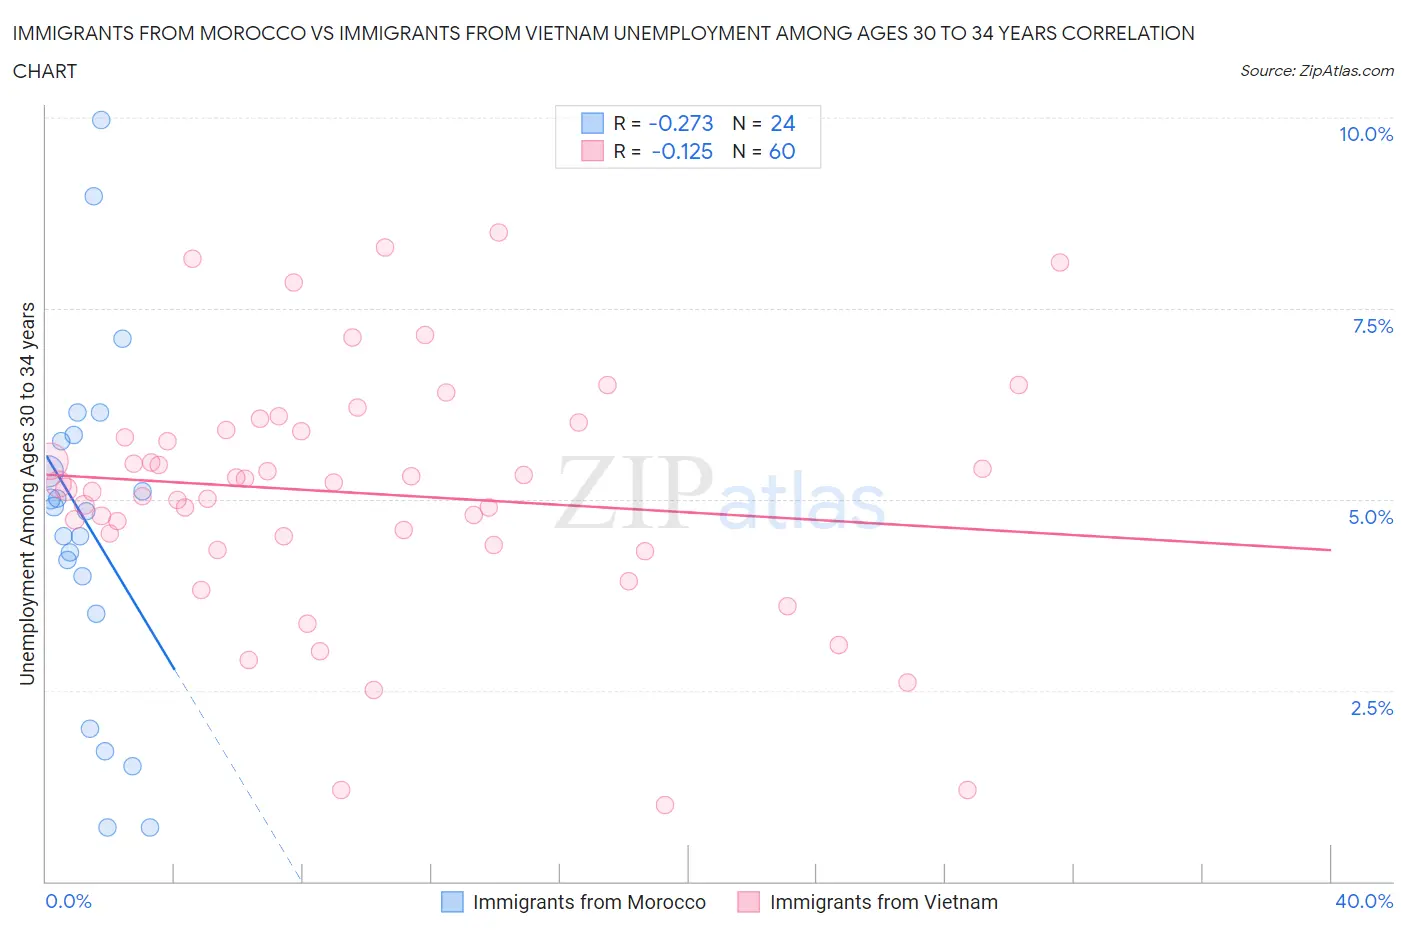
Immigrants from Morocco vs Immigrants from Vietnam Unemployment Among Ages 30 to 34 years Correlation Chart
The statistical analysis conducted on geographies consisting of 175,536,511 people shows a weak negative correlation between the proportion of Immigrants from Morocco and unemployment rate among population between the ages 30 and 34 in the United States with a correlation coefficient (R) of -0.273 and weighted average of 5.1%. Similarly, the statistical analysis conducted on geographies consisting of 383,818,102 people shows a poor negative correlation between the proportion of Immigrants from Vietnam and unemployment rate among population between the ages 30 and 34 in the United States with a correlation coefficient (R) of -0.125 and weighted average of 5.0%, a difference of 1.3%.
Unemployment Among Ages 30 to 34 years Correlation Summary
| Measurement | Immigrants from Morocco | Immigrants from Vietnam |
| Minimum | 0.70% | 1.0% |
| Maximum | 10.0% | 8.5% |
| Range | 9.3% | 7.5% |
| Mean | 4.7% | 5.1% |
| Median | 4.9% | 5.2% |
| Interquartile 25% (IQ1) | 3.7% | 4.5% |
| Interquartile 75% (IQ3) | 5.8% | 5.9% |
| Interquartile Range (IQR) | 2.1% | 1.4% |
| Standard Deviation (Sample) | 2.3% | 1.6% |
| Standard Deviation (Population) | 2.2% | 1.6% |
Demographics Similar to Immigrants from Morocco and Immigrants from Vietnam by Unemployment Among Ages 30 to 34 years
In terms of unemployment among ages 30 to 34 years, the demographic groups most similar to Immigrants from Morocco are Cuban (5.1%, a difference of 0.18%), Chinese (5.1%, a difference of 0.20%), Immigrants from Burma/Myanmar (5.1%, a difference of 0.23%), Turkish (5.1%, a difference of 0.26%), and Puget Sound Salish (5.1%, a difference of 0.30%). Similarly, the demographic groups most similar to Immigrants from Vietnam are Immigrants from Eastern Africa (5.0%, a difference of 0.0%), Fijian (5.0%, a difference of 0.080%), Sri Lankan (5.0%, a difference of 0.18%), Immigrants from Hong Kong (5.0%, a difference of 0.18%), and Immigrants from Turkey (5.0%, a difference of 0.19%).
| Demographics | Rating | Rank | Unemployment Among Ages 30 to 34 years |
| Immigrants | Turkey | 99.0 /100 | #37 | Exceptional 5.0% |
| Sri Lankans | 99.0 /100 | #38 | Exceptional 5.0% |
| Fijians | 99.0 /100 | #39 | Exceptional 5.0% |
| Immigrants | Vietnam | 98.9 /100 | #40 | Exceptional 5.0% |
| Immigrants | Eastern Africa | 98.9 /100 | #41 | Exceptional 5.0% |
| Immigrants | Hong Kong | 98.8 /100 | #42 | Exceptional 5.0% |
| Soviet Union | 98.8 /100 | #43 | Exceptional 5.0% |
| Immigrants | Belgium | 98.7 /100 | #44 | Exceptional 5.1% |
| Yugoslavians | 98.6 /100 | #45 | Exceptional 5.1% |
| Immigrants | Congo | 98.4 /100 | #46 | Exceptional 5.1% |
| Cypriots | 98.4 /100 | #47 | Exceptional 5.1% |
| Assyrians/Chaldeans/Syriacs | 98.4 /100 | #48 | Exceptional 5.1% |
| Immigrants | Malaysia | 98.3 /100 | #49 | Exceptional 5.1% |
| Puget Sound Salish | 98.2 /100 | #50 | Exceptional 5.1% |
| Turks | 98.2 /100 | #51 | Exceptional 5.1% |
| Immigrants | Burma/Myanmar | 98.1 /100 | #52 | Exceptional 5.1% |
| Cubans | 98.1 /100 | #53 | Exceptional 5.1% |
| Immigrants | Morocco | 97.9 /100 | #54 | Exceptional 5.1% |
| Chinese | 97.7 /100 | #55 | Exceptional 5.1% |
| Immigrants | Serbia | 97.4 /100 | #56 | Exceptional 5.1% |
| Immigrants | China | 97.2 /100 | #57 | Exceptional 5.1% |