Trinidadian and Tobagonian vs Immigrants from Argentina Unemployment Among Ages 55 to 59 years
COMPARE
Trinidadian and Tobagonian
Immigrants from Argentina
Unemployment Among Ages 55 to 59 years
Unemployment Among Ages 55 to 59 years Comparison
Trinidadians and Tobagonians
Immigrants from Argentina
5.3%
UNEMPLOYMENT AMONG AGES 55 TO 59 YEARS
0.0/ 100
METRIC RATING
291st/ 347
METRIC RANK
4.6%
UNEMPLOYMENT AMONG AGES 55 TO 59 YEARS
99.5/ 100
METRIC RATING
61st/ 347
METRIC RANK
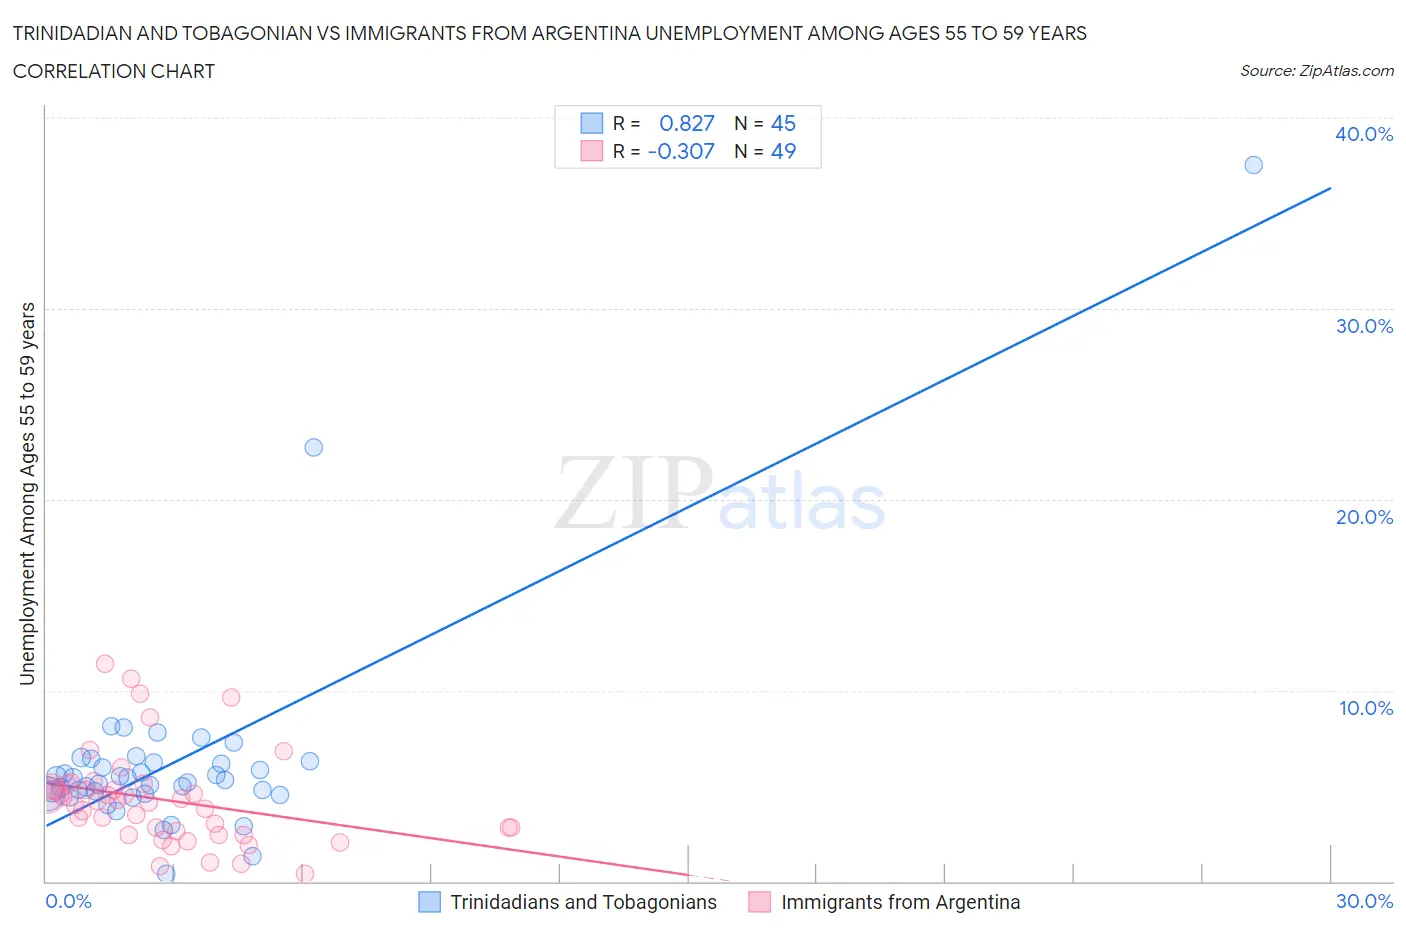
Trinidadian and Tobagonian vs Immigrants from Argentina Unemployment Among Ages 55 to 59 years Correlation Chart
The statistical analysis conducted on geographies consisting of 211,643,206 people shows a very strong positive correlation between the proportion of Trinidadians and Tobagonians and unemployment rate among population between the ages 55 and 59 in the United States with a correlation coefficient (R) of 0.827 and weighted average of 5.3%. Similarly, the statistical analysis conducted on geographies consisting of 253,318,909 people shows a mild negative correlation between the proportion of Immigrants from Argentina and unemployment rate among population between the ages 55 and 59 in the United States with a correlation coefficient (R) of -0.307 and weighted average of 4.6%, a difference of 16.2%.
Unemployment Among Ages 55 to 59 years Correlation Summary
| Measurement | Trinidadian and Tobagonian | Immigrants from Argentina |
| Minimum | 0.40% | 0.40% |
| Maximum | 37.5% | 11.4% |
| Range | 37.1% | 11.0% |
| Mean | 6.3% | 4.3% |
| Median | 5.3% | 4.2% |
| Interquartile 25% (IQ1) | 4.6% | 2.5% |
| Interquartile 75% (IQ3) | 6.3% | 5.0% |
| Interquartile Range (IQR) | 1.7% | 2.5% |
| Standard Deviation (Sample) | 5.6% | 2.5% |
| Standard Deviation (Population) | 5.6% | 2.4% |
Similar Demographics by Unemployment Among Ages 55 to 59 years
Demographics Similar to Trinidadians and Tobagonians by Unemployment Among Ages 55 to 59 years
In terms of unemployment among ages 55 to 59 years, the demographic groups most similar to Trinidadians and Tobagonians are Sioux (5.3%, a difference of 0.070%), Immigrants from Central America (5.3%, a difference of 0.10%), British West Indian (5.3%, a difference of 0.14%), Immigrants from Israel (5.3%, a difference of 0.16%), and Immigrants from Guatemala (5.3%, a difference of 0.17%).
| Demographics | Rating | Rank | Unemployment Among Ages 55 to 59 years |
| Ghanaians | 0.0 /100 | #284 | Tragic 5.3% |
| Armenians | 0.0 /100 | #285 | Tragic 5.3% |
| Immigrants | Ghana | 0.0 /100 | #286 | Tragic 5.3% |
| Immigrants | Guatemala | 0.0 /100 | #287 | Tragic 5.3% |
| Immigrants | Israel | 0.0 /100 | #288 | Tragic 5.3% |
| Immigrants | Central America | 0.0 /100 | #289 | Tragic 5.3% |
| Sioux | 0.0 /100 | #290 | Tragic 5.3% |
| Trinidadians and Tobagonians | 0.0 /100 | #291 | Tragic 5.3% |
| British West Indians | 0.0 /100 | #292 | Tragic 5.3% |
| Immigrants | Grenada | 0.0 /100 | #293 | Tragic 5.3% |
| Cajuns | 0.0 /100 | #294 | Tragic 5.3% |
| Dutch West Indians | 0.0 /100 | #295 | Tragic 5.3% |
| Barbadians | 0.0 /100 | #296 | Tragic 5.3% |
| Immigrants | Mexico | 0.0 /100 | #297 | Tragic 5.3% |
| Hispanics or Latinos | 0.0 /100 | #298 | Tragic 5.4% |
Demographics Similar to Immigrants from Argentina by Unemployment Among Ages 55 to 59 years
In terms of unemployment among ages 55 to 59 years, the demographic groups most similar to Immigrants from Argentina are Dutch (4.6%, a difference of 0.090%), Immigrants from Uganda (4.6%, a difference of 0.13%), Slovene (4.6%, a difference of 0.25%), Immigrants from South Central Asia (4.6%, a difference of 0.33%), and Okinawan (4.5%, a difference of 0.36%).
| Demographics | Rating | Rank | Unemployment Among Ages 55 to 59 years |
| Burmese | 99.7 /100 | #54 | Exceptional 4.5% |
| Immigrants | Nepal | 99.6 /100 | #55 | Exceptional 4.5% |
| Welsh | 99.6 /100 | #56 | Exceptional 4.5% |
| Northern Europeans | 99.6 /100 | #57 | Exceptional 4.5% |
| Okinawans | 99.6 /100 | #58 | Exceptional 4.5% |
| Immigrants | Uganda | 99.5 /100 | #59 | Exceptional 4.6% |
| Dutch | 99.5 /100 | #60 | Exceptional 4.6% |
| Immigrants | Argentina | 99.5 /100 | #61 | Exceptional 4.6% |
| Slovenes | 99.3 /100 | #62 | Exceptional 4.6% |
| Immigrants | South Central Asia | 99.3 /100 | #63 | Exceptional 4.6% |
| Argentineans | 99.1 /100 | #64 | Exceptional 4.6% |
| Sudanese | 99.1 /100 | #65 | Exceptional 4.6% |
| Mongolians | 99.0 /100 | #66 | Exceptional 4.6% |
| Ugandans | 99.0 /100 | #67 | Exceptional 4.6% |
| Immigrants | Micronesia | 99.0 /100 | #68 | Exceptional 4.6% |