Immigrants from Zimbabwe vs Pueblo Unemployment Among Youth under 25 years
COMPARE
Immigrants from Zimbabwe
Pueblo
Unemployment Among Youth under 25 years
Unemployment Among Youth under 25 years Comparison
Immigrants from Zimbabwe
Pueblo
10.8%
UNEMPLOYMENT AMONG YOUTH UNDER 25 YEARS
99.8/ 100
METRIC RATING
37th/ 347
METRIC RANK
13.9%
UNEMPLOYMENT AMONG YOUTH UNDER 25 YEARS
0.0/ 100
METRIC RATING
306th/ 347
METRIC RANK
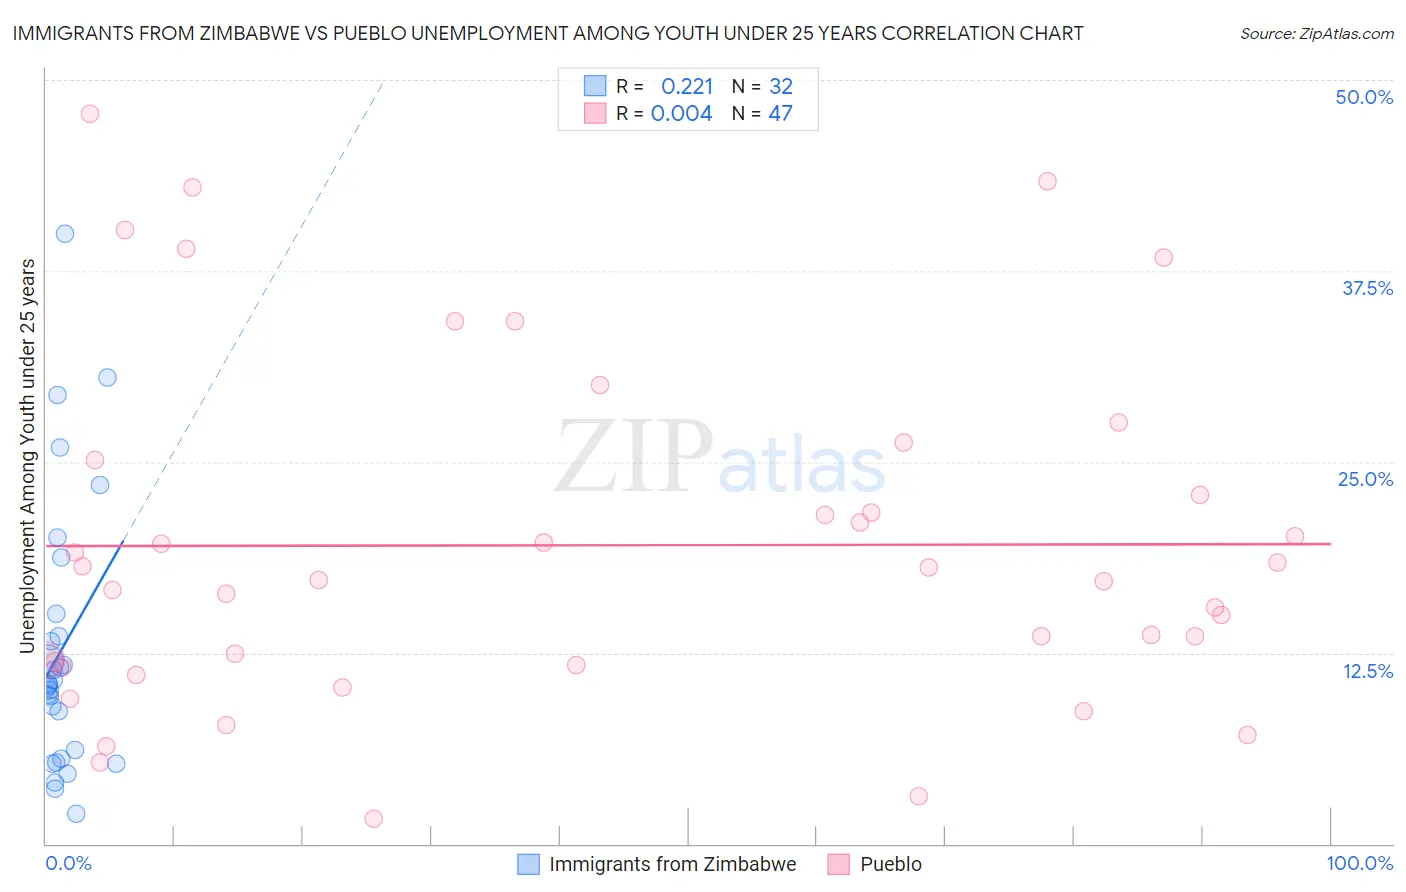
Immigrants from Zimbabwe vs Pueblo Unemployment Among Youth under 25 years Correlation Chart
The statistical analysis conducted on geographies consisting of 117,412,367 people shows a weak positive correlation between the proportion of Immigrants from Zimbabwe and unemployment rate among youth under the age of 25 in the United States with a correlation coefficient (R) of 0.221 and weighted average of 10.8%. Similarly, the statistical analysis conducted on geographies consisting of 119,696,762 people shows no correlation between the proportion of Pueblo and unemployment rate among youth under the age of 25 in the United States with a correlation coefficient (R) of 0.004 and weighted average of 13.9%, a difference of 28.0%.
Unemployment Among Youth under 25 years Correlation Summary
| Measurement | Immigrants from Zimbabwe | Pueblo |
| Minimum | 2.0% | 1.6% |
| Maximum | 39.9% | 47.8% |
| Range | 37.9% | 46.2% |
| Mean | 12.7% | 19.5% |
| Median | 10.4% | 17.3% |
| Interquartile 25% (IQ1) | 5.8% | 11.7% |
| Interquartile 75% (IQ3) | 14.3% | 25.1% |
| Interquartile Range (IQR) | 8.5% | 13.4% |
| Standard Deviation (Sample) | 8.8% | 11.3% |
| Standard Deviation (Population) | 8.7% | 11.2% |
Similar Demographics by Unemployment Among Youth under 25 years
Demographics Similar to Immigrants from Zimbabwe by Unemployment Among Youth under 25 years
In terms of unemployment among youth under 25 years, the demographic groups most similar to Immigrants from Zimbabwe are Immigrants from Congo (10.9%, a difference of 0.070%), Immigrants from Zaire (10.9%, a difference of 0.080%), Hmong (10.8%, a difference of 0.15%), Scottish (10.9%, a difference of 0.24%), and Immigrants from Nepal (10.8%, a difference of 0.29%).
| Demographics | Rating | Rank | Unemployment Among Youth under 25 years |
| Osage | 99.9 /100 | #30 | Exceptional 10.7% |
| Slovenes | 99.9 /100 | #31 | Exceptional 10.7% |
| Taiwanese | 99.9 /100 | #32 | Exceptional 10.8% |
| Europeans | 99.9 /100 | #33 | Exceptional 10.8% |
| English | 99.9 /100 | #34 | Exceptional 10.8% |
| Immigrants | Nepal | 99.9 /100 | #35 | Exceptional 10.8% |
| Hmong | 99.8 /100 | #36 | Exceptional 10.8% |
| Immigrants | Zimbabwe | 99.8 /100 | #37 | Exceptional 10.8% |
| Immigrants | Congo | 99.8 /100 | #38 | Exceptional 10.9% |
| Immigrants | Zaire | 99.8 /100 | #39 | Exceptional 10.9% |
| Scottish | 99.8 /100 | #40 | Exceptional 10.9% |
| Croatians | 99.8 /100 | #41 | Exceptional 10.9% |
| Cambodians | 99.7 /100 | #42 | Exceptional 10.9% |
| British | 99.7 /100 | #43 | Exceptional 10.9% |
| Welsh | 99.7 /100 | #44 | Exceptional 10.9% |
Demographics Similar to Pueblo by Unemployment Among Youth under 25 years
In terms of unemployment among youth under 25 years, the demographic groups most similar to Pueblo are Haitian (13.9%, a difference of 0.070%), Belizean (13.8%, a difference of 0.40%), Houma (13.8%, a difference of 0.40%), Immigrants from Sierra Leone (13.8%, a difference of 0.44%), and Immigrants from Senegal (13.8%, a difference of 0.49%).
| Demographics | Rating | Rank | Unemployment Among Youth under 25 years |
| Tohono O'odham | 0.0 /100 | #299 | Tragic 13.8% |
| Immigrants | Cabo Verde | 0.0 /100 | #300 | Tragic 13.8% |
| Immigrants | Senegal | 0.0 /100 | #301 | Tragic 13.8% |
| Immigrants | Sierra Leone | 0.0 /100 | #302 | Tragic 13.8% |
| Belizeans | 0.0 /100 | #303 | Tragic 13.8% |
| Houma | 0.0 /100 | #304 | Tragic 13.8% |
| Haitians | 0.0 /100 | #305 | Tragic 13.9% |
| Pueblo | 0.0 /100 | #306 | Tragic 13.9% |
| Immigrants | Haiti | 0.0 /100 | #307 | Tragic 14.0% |
| Immigrants | Belize | 0.0 /100 | #308 | Tragic 14.0% |
| Aleuts | 0.0 /100 | #309 | Tragic 14.1% |
| Immigrants | West Indies | 0.0 /100 | #310 | Tragic 14.2% |
| Immigrants | Bangladesh | 0.0 /100 | #311 | Tragic 14.2% |
| Vietnamese | 0.0 /100 | #312 | Tragic 14.3% |
| Immigrants | Armenia | 0.0 /100 | #313 | Tragic 14.4% |