Immigrants from Zimbabwe vs Creek Unemployment Among Youth under 25 years
COMPARE
Immigrants from Zimbabwe
Creek
Unemployment Among Youth under 25 years
Unemployment Among Youth under 25 years Comparison
Immigrants from Zimbabwe
Creek
10.8%
UNEMPLOYMENT AMONG YOUTH UNDER 25 YEARS
99.8/ 100
METRIC RATING
37th/ 347
METRIC RANK
11.2%
UNEMPLOYMENT AMONG YOUTH UNDER 25 YEARS
97.2/ 100
METRIC RATING
73rd/ 347
METRIC RANK
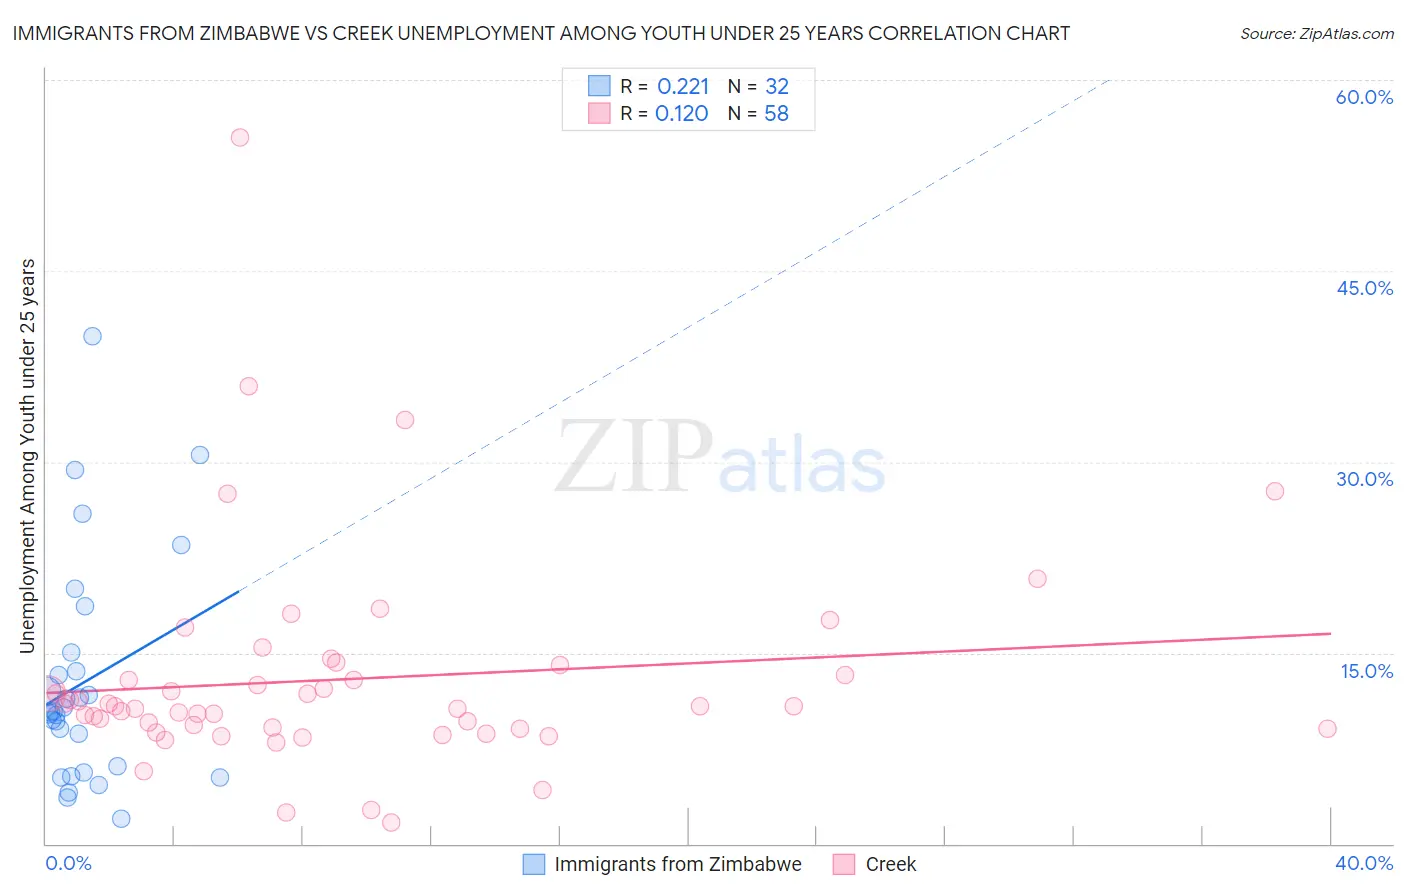
Immigrants from Zimbabwe vs Creek Unemployment Among Youth under 25 years Correlation Chart
The statistical analysis conducted on geographies consisting of 117,412,367 people shows a weak positive correlation between the proportion of Immigrants from Zimbabwe and unemployment rate among youth under the age of 25 in the United States with a correlation coefficient (R) of 0.221 and weighted average of 10.8%. Similarly, the statistical analysis conducted on geographies consisting of 177,085,526 people shows a poor positive correlation between the proportion of Creek and unemployment rate among youth under the age of 25 in the United States with a correlation coefficient (R) of 0.120 and weighted average of 11.2%, a difference of 3.1%.
Unemployment Among Youth under 25 years Correlation Summary
| Measurement | Immigrants from Zimbabwe | Creek |
| Minimum | 2.0% | 1.7% |
| Maximum | 39.9% | 55.5% |
| Range | 37.9% | 53.8% |
| Mean | 12.7% | 12.9% |
| Median | 10.4% | 10.8% |
| Interquartile 25% (IQ1) | 5.8% | 9.0% |
| Interquartile 75% (IQ3) | 14.3% | 13.3% |
| Interquartile Range (IQR) | 8.5% | 4.3% |
| Standard Deviation (Sample) | 8.8% | 8.6% |
| Standard Deviation (Population) | 8.7% | 8.5% |
Similar Demographics by Unemployment Among Youth under 25 years
Demographics Similar to Immigrants from Zimbabwe by Unemployment Among Youth under 25 years
In terms of unemployment among youth under 25 years, the demographic groups most similar to Immigrants from Zimbabwe are Immigrants from Congo (10.9%, a difference of 0.070%), Immigrants from Zaire (10.9%, a difference of 0.080%), Hmong (10.8%, a difference of 0.15%), Scottish (10.9%, a difference of 0.24%), and Immigrants from Nepal (10.8%, a difference of 0.29%).
| Demographics | Rating | Rank | Unemployment Among Youth under 25 years |
| Osage | 99.9 /100 | #30 | Exceptional 10.7% |
| Slovenes | 99.9 /100 | #31 | Exceptional 10.7% |
| Taiwanese | 99.9 /100 | #32 | Exceptional 10.8% |
| Europeans | 99.9 /100 | #33 | Exceptional 10.8% |
| English | 99.9 /100 | #34 | Exceptional 10.8% |
| Immigrants | Nepal | 99.9 /100 | #35 | Exceptional 10.8% |
| Hmong | 99.8 /100 | #36 | Exceptional 10.8% |
| Immigrants | Zimbabwe | 99.8 /100 | #37 | Exceptional 10.8% |
| Immigrants | Congo | 99.8 /100 | #38 | Exceptional 10.9% |
| Immigrants | Zaire | 99.8 /100 | #39 | Exceptional 10.9% |
| Scottish | 99.8 /100 | #40 | Exceptional 10.9% |
| Croatians | 99.8 /100 | #41 | Exceptional 10.9% |
| Cambodians | 99.7 /100 | #42 | Exceptional 10.9% |
| British | 99.7 /100 | #43 | Exceptional 10.9% |
| Welsh | 99.7 /100 | #44 | Exceptional 10.9% |
Demographics Similar to Creek by Unemployment Among Youth under 25 years
In terms of unemployment among youth under 25 years, the demographic groups most similar to Creek are New Zealander (11.2%, a difference of 0.010%), French (11.2%, a difference of 0.040%), Immigrants from Australia (11.2%, a difference of 0.050%), German Russian (11.2%, a difference of 0.060%), and Bhutanese (11.2%, a difference of 0.090%).
| Demographics | Rating | Rank | Unemployment Among Youth under 25 years |
| Macedonians | 97.7 /100 | #66 | Exceptional 11.2% |
| Chickasaw | 97.7 /100 | #67 | Exceptional 11.2% |
| Immigrants | Kenya | 97.6 /100 | #68 | Exceptional 11.2% |
| Immigrants | Moldova | 97.5 /100 | #69 | Exceptional 11.2% |
| Slavs | 97.5 /100 | #70 | Exceptional 11.2% |
| Bhutanese | 97.4 /100 | #71 | Exceptional 11.2% |
| Immigrants | Australia | 97.3 /100 | #72 | Exceptional 11.2% |
| Creek | 97.2 /100 | #73 | Exceptional 11.2% |
| New Zealanders | 97.2 /100 | #74 | Exceptional 11.2% |
| French | 97.1 /100 | #75 | Exceptional 11.2% |
| German Russians | 97.0 /100 | #76 | Exceptional 11.2% |
| Whites/Caucasians | 96.9 /100 | #77 | Exceptional 11.2% |
| Immigrants | Nicaragua | 96.7 /100 | #78 | Exceptional 11.2% |
| Immigrants | Canada | 96.7 /100 | #79 | Exceptional 11.2% |
| Immigrants | Bulgaria | 96.4 /100 | #80 | Exceptional 11.2% |