Iroquois vs Pueblo Unemployment Among Youth under 25 years
COMPARE
Iroquois
Pueblo
Unemployment Among Youth under 25 years
Unemployment Among Youth under 25 years Comparison
Iroquois
Pueblo
11.3%
UNEMPLOYMENT AMONG YOUTH UNDER 25 YEARS
93.8/ 100
METRIC RATING
101st/ 347
METRIC RANK
13.9%
UNEMPLOYMENT AMONG YOUTH UNDER 25 YEARS
0.0/ 100
METRIC RATING
306th/ 347
METRIC RANK
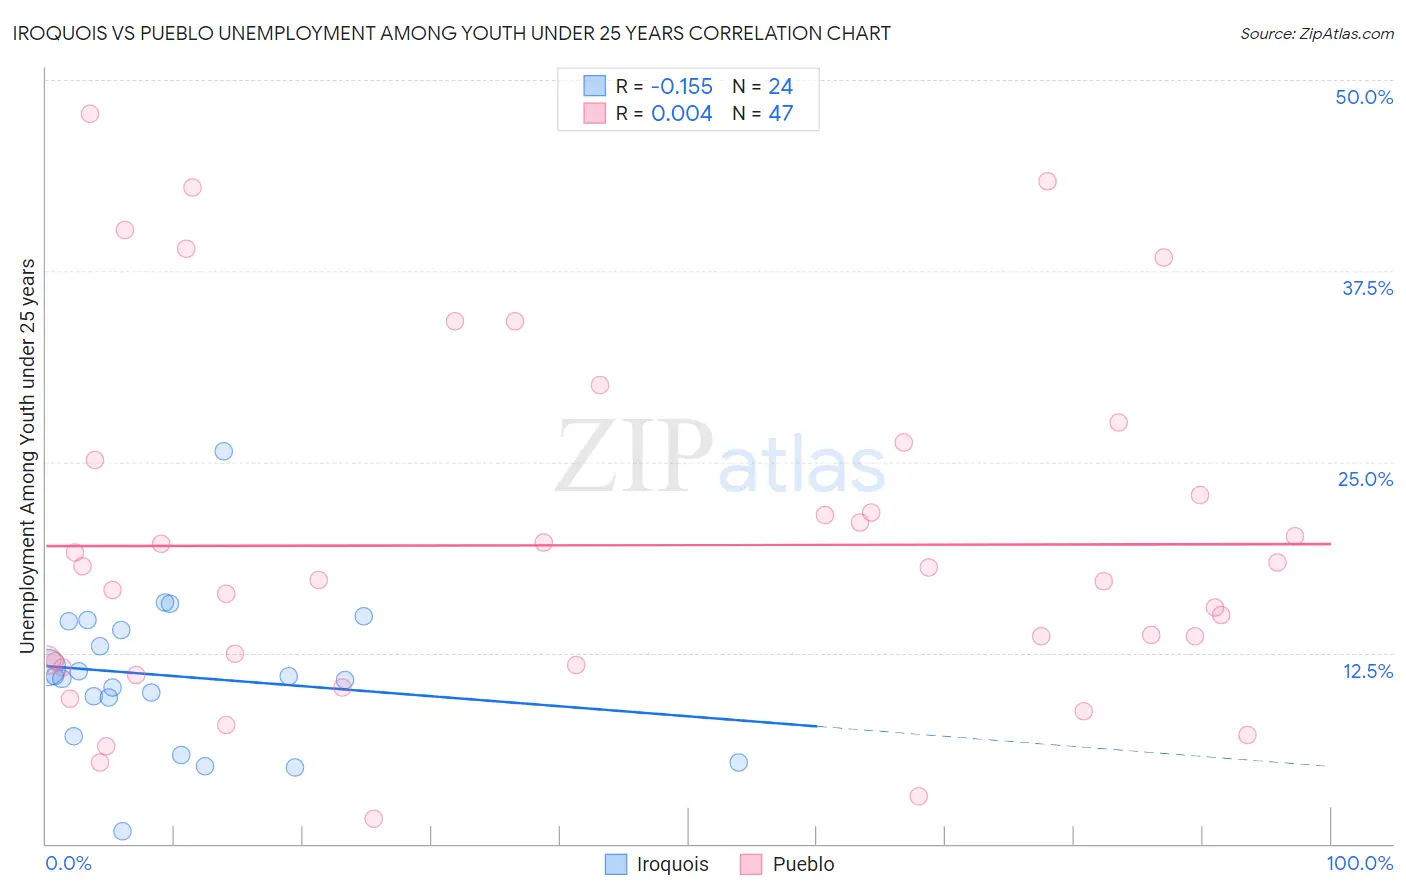
Iroquois vs Pueblo Unemployment Among Youth under 25 years Correlation Chart
The statistical analysis conducted on geographies consisting of 205,569,055 people shows a poor negative correlation between the proportion of Iroquois and unemployment rate among youth under the age of 25 in the United States with a correlation coefficient (R) of -0.155 and weighted average of 11.3%. Similarly, the statistical analysis conducted on geographies consisting of 119,696,762 people shows no correlation between the proportion of Pueblo and unemployment rate among youth under the age of 25 in the United States with a correlation coefficient (R) of 0.004 and weighted average of 13.9%, a difference of 23.1%.
Unemployment Among Youth under 25 years Correlation Summary
| Measurement | Iroquois | Pueblo |
| Minimum | 0.80% | 1.6% |
| Maximum | 25.7% | 47.8% |
| Range | 24.9% | 46.2% |
| Mean | 11.0% | 19.5% |
| Median | 10.9% | 17.3% |
| Interquartile 25% (IQ1) | 8.3% | 11.7% |
| Interquartile 75% (IQ3) | 14.3% | 25.1% |
| Interquartile Range (IQR) | 6.0% | 13.4% |
| Standard Deviation (Sample) | 5.0% | 11.3% |
| Standard Deviation (Population) | 4.9% | 11.2% |
Similar Demographics by Unemployment Among Youth under 25 years
Demographics Similar to Iroquois by Unemployment Among Youth under 25 years
In terms of unemployment among youth under 25 years, the demographic groups most similar to Iroquois are Pakistani (11.3%, a difference of 0.020%), Celtic (11.3%, a difference of 0.030%), Immigrants from Thailand (11.3%, a difference of 0.050%), Immigrants from Malaysia (11.3%, a difference of 0.050%), and Immigrants from Afghanistan (11.3%, a difference of 0.070%).
| Demographics | Rating | Rank | Unemployment Among Youth under 25 years |
| Lithuanians | 94.8 /100 | #94 | Exceptional 11.3% |
| Carpatho Rusyns | 94.4 /100 | #95 | Exceptional 11.3% |
| Immigrants | Serbia | 94.4 /100 | #96 | Exceptional 11.3% |
| Nicaraguans | 94.3 /100 | #97 | Exceptional 11.3% |
| Estonians | 94.2 /100 | #98 | Exceptional 11.3% |
| Celtics | 94.0 /100 | #99 | Exceptional 11.3% |
| Pakistanis | 94.0 /100 | #100 | Exceptional 11.3% |
| Iroquois | 93.8 /100 | #101 | Exceptional 11.3% |
| Immigrants | Thailand | 93.6 /100 | #102 | Exceptional 11.3% |
| Immigrants | Malaysia | 93.6 /100 | #103 | Exceptional 11.3% |
| Immigrants | Afghanistan | 93.4 /100 | #104 | Exceptional 11.3% |
| Immigrants | Jordan | 93.1 /100 | #105 | Exceptional 11.3% |
| Chileans | 93.0 /100 | #106 | Exceptional 11.3% |
| Immigrants | Lithuania | 92.9 /100 | #107 | Exceptional 11.3% |
| Immigrants | Kuwait | 92.9 /100 | #108 | Exceptional 11.3% |
Demographics Similar to Pueblo by Unemployment Among Youth under 25 years
In terms of unemployment among youth under 25 years, the demographic groups most similar to Pueblo are Haitian (13.9%, a difference of 0.070%), Belizean (13.8%, a difference of 0.40%), Houma (13.8%, a difference of 0.40%), Immigrants from Sierra Leone (13.8%, a difference of 0.44%), and Immigrants from Senegal (13.8%, a difference of 0.49%).
| Demographics | Rating | Rank | Unemployment Among Youth under 25 years |
| Tohono O'odham | 0.0 /100 | #299 | Tragic 13.8% |
| Immigrants | Cabo Verde | 0.0 /100 | #300 | Tragic 13.8% |
| Immigrants | Senegal | 0.0 /100 | #301 | Tragic 13.8% |
| Immigrants | Sierra Leone | 0.0 /100 | #302 | Tragic 13.8% |
| Belizeans | 0.0 /100 | #303 | Tragic 13.8% |
| Houma | 0.0 /100 | #304 | Tragic 13.8% |
| Haitians | 0.0 /100 | #305 | Tragic 13.9% |
| Pueblo | 0.0 /100 | #306 | Tragic 13.9% |
| Immigrants | Haiti | 0.0 /100 | #307 | Tragic 14.0% |
| Immigrants | Belize | 0.0 /100 | #308 | Tragic 14.0% |
| Aleuts | 0.0 /100 | #309 | Tragic 14.1% |
| Immigrants | West Indies | 0.0 /100 | #310 | Tragic 14.2% |
| Immigrants | Bangladesh | 0.0 /100 | #311 | Tragic 14.2% |
| Vietnamese | 0.0 /100 | #312 | Tragic 14.3% |
| Immigrants | Armenia | 0.0 /100 | #313 | Tragic 14.4% |