Immigrants from Zaire vs Immigrants from Latvia Unemployment Among Ages 45 to 54 years
COMPARE
Immigrants from Zaire
Immigrants from Latvia
Unemployment Among Ages 45 to 54 years
Unemployment Among Ages 45 to 54 years Comparison
Immigrants from Zaire
Immigrants from Latvia
4.4%
UNEMPLOYMENT AMONG AGES 45 TO 54 YEARS
80.7/ 100
METRIC RATING
140th/ 347
METRIC RANK
4.5%
UNEMPLOYMENT AMONG AGES 45 TO 54 YEARS
77.5/ 100
METRIC RATING
145th/ 347
METRIC RANK
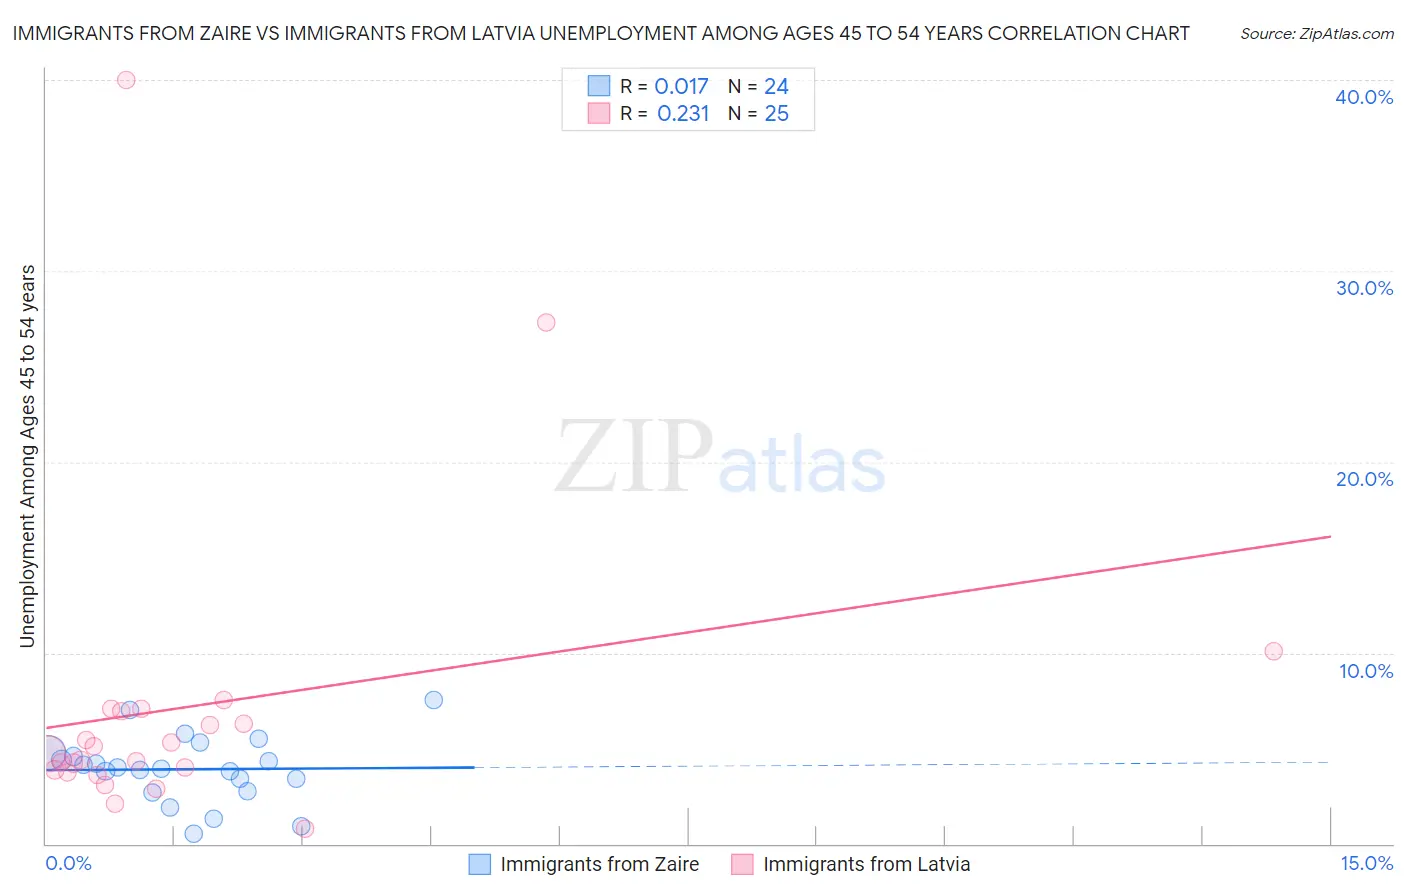
Immigrants from Zaire vs Immigrants from Latvia Unemployment Among Ages 45 to 54 years Correlation Chart
The statistical analysis conducted on geographies consisting of 106,544,284 people shows no correlation between the proportion of Immigrants from Zaire and unemployment rate among population between the ages 45 and 54 in the United States with a correlation coefficient (R) of 0.017 and weighted average of 4.4%. Similarly, the statistical analysis conducted on geographies consisting of 112,896,581 people shows a weak positive correlation between the proportion of Immigrants from Latvia and unemployment rate among population between the ages 45 and 54 in the United States with a correlation coefficient (R) of 0.231 and weighted average of 4.5%, a difference of 0.23%.
Unemployment Among Ages 45 to 54 years Correlation Summary
| Measurement | Immigrants from Zaire | Immigrants from Latvia |
| Minimum | 0.50% | 0.80% |
| Maximum | 7.5% | 40.0% |
| Range | 7.0% | 39.2% |
| Mean | 3.9% | 7.2% |
| Median | 4.0% | 4.7% |
| Interquartile 25% (IQ1) | 3.1% | 3.8% |
| Interquartile 75% (IQ3) | 4.7% | 7.0% |
| Interquartile Range (IQR) | 1.6% | 3.2% |
| Standard Deviation (Sample) | 1.7% | 8.4% |
| Standard Deviation (Population) | 1.7% | 8.2% |
Demographics Similar to Immigrants from Zaire and Immigrants from Latvia by Unemployment Among Ages 45 to 54 years
In terms of unemployment among ages 45 to 54 years, the demographic groups most similar to Immigrants from Zaire are Immigrants from Kuwait (4.4%, a difference of 0.080%), Immigrants from Afghanistan (4.4%, a difference of 0.080%), Immigrants from Congo (4.4%, a difference of 0.090%), Lebanese (4.4%, a difference of 0.10%), and Immigrants from Netherlands (4.4%, a difference of 0.10%). Similarly, the demographic groups most similar to Immigrants from Latvia are Syrian (4.5%, a difference of 0.010%), Taiwanese (4.5%, a difference of 0.030%), Uruguayan (4.5%, a difference of 0.040%), Macedonian (4.5%, a difference of 0.11%), and Immigrants from Netherlands (4.4%, a difference of 0.14%).
| Demographics | Rating | Rank | Unemployment Among Ages 45 to 54 years |
| Immigrants | Eastern Africa | 85.1 /100 | #132 | Excellent 4.4% |
| Immigrants | Cameroon | 84.8 /100 | #133 | Excellent 4.4% |
| Afghans | 84.6 /100 | #134 | Excellent 4.4% |
| Immigrants | Eastern Asia | 84.0 /100 | #135 | Excellent 4.4% |
| Immigrants | Middle Africa | 83.3 /100 | #136 | Excellent 4.4% |
| Lebanese | 81.9 /100 | #137 | Excellent 4.4% |
| Immigrants | Congo | 81.8 /100 | #138 | Excellent 4.4% |
| Immigrants | Kuwait | 81.7 /100 | #139 | Excellent 4.4% |
| Immigrants | Zaire | 80.7 /100 | #140 | Excellent 4.4% |
| Immigrants | Afghanistan | 79.6 /100 | #141 | Good 4.4% |
| Immigrants | Netherlands | 79.4 /100 | #142 | Good 4.4% |
| Macedonians | 79.0 /100 | #143 | Good 4.5% |
| Taiwanese | 77.9 /100 | #144 | Good 4.5% |
| Immigrants | Latvia | 77.5 /100 | #145 | Good 4.5% |
| Syrians | 77.3 /100 | #146 | Good 4.5% |
| Uruguayans | 76.9 /100 | #147 | Good 4.5% |
| Immigrants | Austria | 75.3 /100 | #148 | Good 4.5% |
| Costa Ricans | 75.3 /100 | #149 | Good 4.5% |
| Tsimshian | 74.6 /100 | #150 | Good 4.5% |
| Cypriots | 74.4 /100 | #151 | Good 4.5% |
| Koreans | 73.1 /100 | #152 | Good 4.5% |