Immigrants from Zaire vs Cuban Unemployment Among Ages 45 to 54 years
COMPARE
Immigrants from Zaire
Cuban
Unemployment Among Ages 45 to 54 years
Unemployment Among Ages 45 to 54 years Comparison
Immigrants from Zaire
Cubans
4.4%
UNEMPLOYMENT AMONG AGES 45 TO 54 YEARS
80.7/ 100
METRIC RATING
140th/ 347
METRIC RANK
4.0%
UNEMPLOYMENT AMONG AGES 45 TO 54 YEARS
100.0/ 100
METRIC RATING
13th/ 347
METRIC RANK
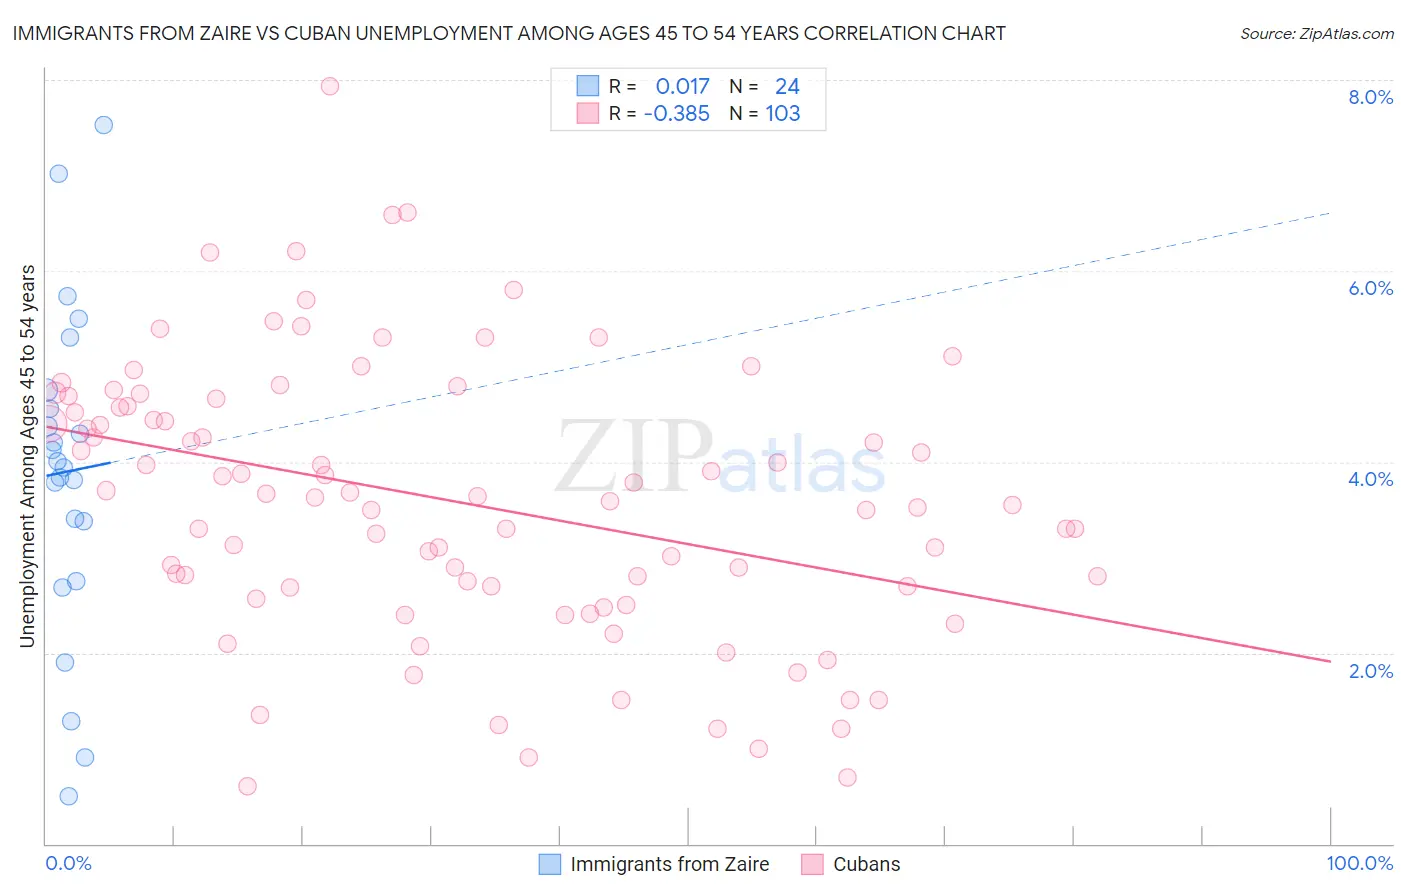
Immigrants from Zaire vs Cuban Unemployment Among Ages 45 to 54 years Correlation Chart
The statistical analysis conducted on geographies consisting of 106,544,284 people shows no correlation between the proportion of Immigrants from Zaire and unemployment rate among population between the ages 45 and 54 in the United States with a correlation coefficient (R) of 0.017 and weighted average of 4.4%. Similarly, the statistical analysis conducted on geographies consisting of 435,915,354 people shows a mild negative correlation between the proportion of Cubans and unemployment rate among population between the ages 45 and 54 in the United States with a correlation coefficient (R) of -0.385 and weighted average of 4.0%, a difference of 11.0%.
Unemployment Among Ages 45 to 54 years Correlation Summary
| Measurement | Immigrants from Zaire | Cuban |
| Minimum | 0.50% | 0.60% |
| Maximum | 7.5% | 7.9% |
| Range | 7.0% | 7.3% |
| Mean | 3.9% | 3.6% |
| Median | 4.0% | 3.6% |
| Interquartile 25% (IQ1) | 3.1% | 2.7% |
| Interquartile 75% (IQ3) | 4.7% | 4.6% |
| Interquartile Range (IQR) | 1.6% | 1.9% |
| Standard Deviation (Sample) | 1.7% | 1.4% |
| Standard Deviation (Population) | 1.7% | 1.4% |
Similar Demographics by Unemployment Among Ages 45 to 54 years
Demographics Similar to Immigrants from Zaire by Unemployment Among Ages 45 to 54 years
In terms of unemployment among ages 45 to 54 years, the demographic groups most similar to Immigrants from Zaire are Immigrants from Kuwait (4.4%, a difference of 0.080%), Immigrants from Afghanistan (4.4%, a difference of 0.080%), Immigrants from Congo (4.4%, a difference of 0.090%), Lebanese (4.4%, a difference of 0.10%), and Immigrants from Netherlands (4.4%, a difference of 0.10%).
| Demographics | Rating | Rank | Unemployment Among Ages 45 to 54 years |
| Immigrants | Cameroon | 84.8 /100 | #133 | Excellent 4.4% |
| Afghans | 84.6 /100 | #134 | Excellent 4.4% |
| Immigrants | Eastern Asia | 84.0 /100 | #135 | Excellent 4.4% |
| Immigrants | Middle Africa | 83.3 /100 | #136 | Excellent 4.4% |
| Lebanese | 81.9 /100 | #137 | Excellent 4.4% |
| Immigrants | Congo | 81.8 /100 | #138 | Excellent 4.4% |
| Immigrants | Kuwait | 81.7 /100 | #139 | Excellent 4.4% |
| Immigrants | Zaire | 80.7 /100 | #140 | Excellent 4.4% |
| Immigrants | Afghanistan | 79.6 /100 | #141 | Good 4.4% |
| Immigrants | Netherlands | 79.4 /100 | #142 | Good 4.4% |
| Macedonians | 79.0 /100 | #143 | Good 4.5% |
| Taiwanese | 77.9 /100 | #144 | Good 4.5% |
| Immigrants | Latvia | 77.5 /100 | #145 | Good 4.5% |
| Syrians | 77.3 /100 | #146 | Good 4.5% |
| Uruguayans | 76.9 /100 | #147 | Good 4.5% |
Demographics Similar to Cubans by Unemployment Among Ages 45 to 54 years
In terms of unemployment among ages 45 to 54 years, the demographic groups most similar to Cubans are Immigrants from Bosnia and Herzegovina (4.0%, a difference of 0.050%), Swedish (4.0%, a difference of 0.15%), Scandinavian (4.0%, a difference of 0.16%), Venezuelan (4.0%, a difference of 0.30%), and Immigrants from Bolivia (4.0%, a difference of 0.48%).
| Demographics | Rating | Rank | Unemployment Among Ages 45 to 54 years |
| Immigrants | Cuba | 100.0 /100 | #6 | Exceptional 3.9% |
| Immigrants | Venezuela | 100.0 /100 | #7 | Exceptional 3.9% |
| Chinese | 100.0 /100 | #8 | Exceptional 4.0% |
| Czechs | 100.0 /100 | #9 | Exceptional 4.0% |
| Venezuelans | 100.0 /100 | #10 | Exceptional 4.0% |
| Scandinavians | 100.0 /100 | #11 | Exceptional 4.0% |
| Swedes | 100.0 /100 | #12 | Exceptional 4.0% |
| Cubans | 100.0 /100 | #13 | Exceptional 4.0% |
| Immigrants | Bosnia and Herzegovina | 100.0 /100 | #14 | Exceptional 4.0% |
| Immigrants | Bolivia | 100.0 /100 | #15 | Exceptional 4.0% |
| Thais | 100.0 /100 | #16 | Exceptional 4.0% |
| Tongans | 100.0 /100 | #17 | Exceptional 4.1% |
| Germans | 100.0 /100 | #18 | Exceptional 4.1% |
| Swiss | 100.0 /100 | #19 | Exceptional 4.1% |
| English | 100.0 /100 | #20 | Exceptional 4.1% |