Hungarian vs Immigrants from Latvia Unemployment Among Ages 45 to 54 years
COMPARE
Hungarian
Immigrants from Latvia
Unemployment Among Ages 45 to 54 years
Unemployment Among Ages 45 to 54 years Comparison
Hungarians
Immigrants from Latvia
4.5%
UNEMPLOYMENT AMONG AGES 45 TO 54 YEARS
73.0/ 100
METRIC RATING
153rd/ 347
METRIC RANK
4.5%
UNEMPLOYMENT AMONG AGES 45 TO 54 YEARS
77.5/ 100
METRIC RATING
145th/ 347
METRIC RANK
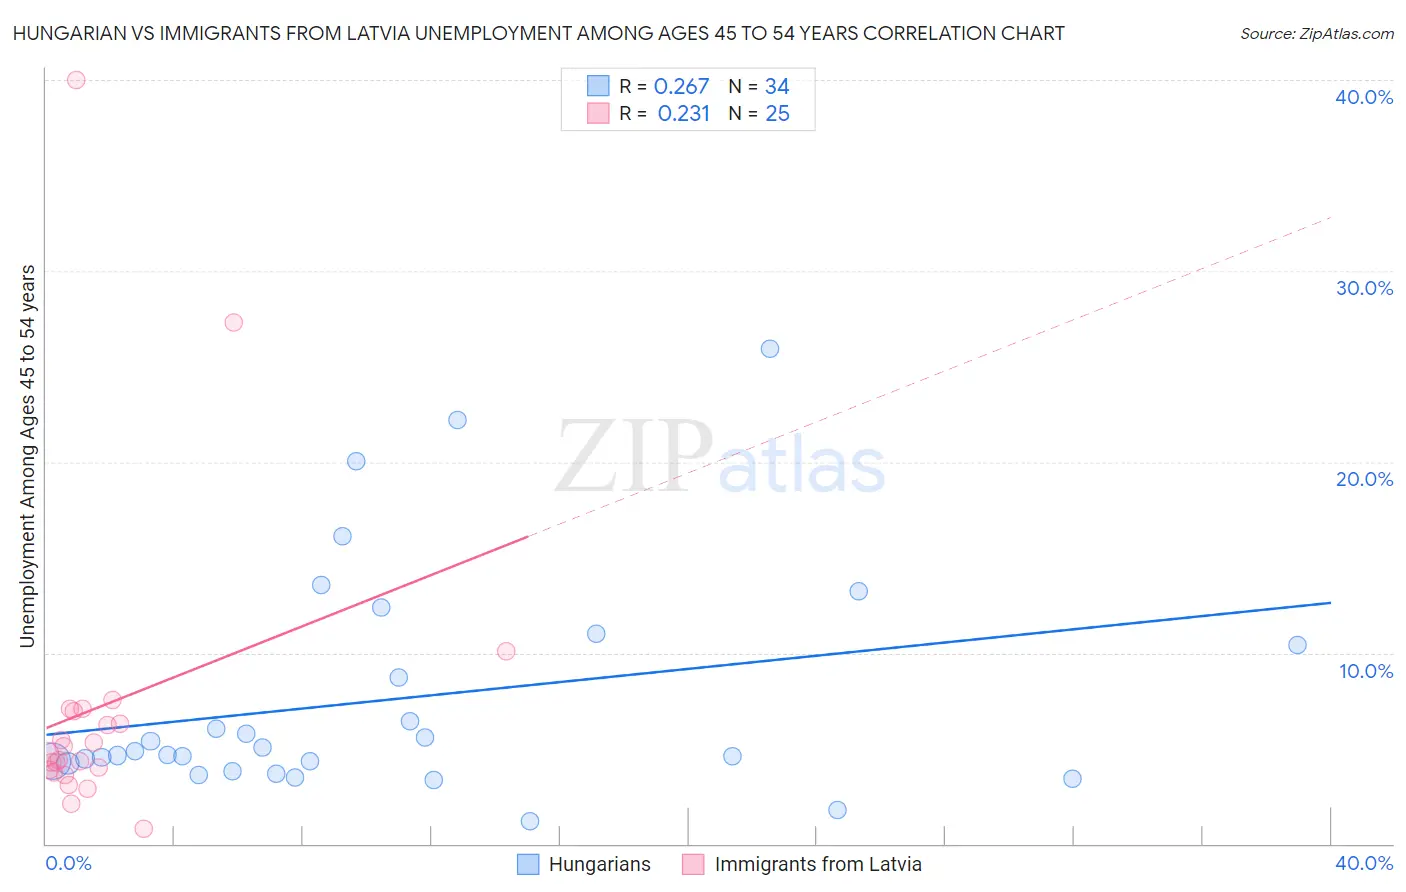
Hungarian vs Immigrants from Latvia Unemployment Among Ages 45 to 54 years Correlation Chart
The statistical analysis conducted on geographies consisting of 464,373,279 people shows a weak positive correlation between the proportion of Hungarians and unemployment rate among population between the ages 45 and 54 in the United States with a correlation coefficient (R) of 0.267 and weighted average of 4.5%. Similarly, the statistical analysis conducted on geographies consisting of 112,896,581 people shows a weak positive correlation between the proportion of Immigrants from Latvia and unemployment rate among population between the ages 45 and 54 in the United States with a correlation coefficient (R) of 0.231 and weighted average of 4.5%, a difference of 0.29%.
Unemployment Among Ages 45 to 54 years Correlation Summary
| Measurement | Hungarian | Immigrants from Latvia |
| Minimum | 1.2% | 0.80% |
| Maximum | 25.9% | 40.0% |
| Range | 24.7% | 39.2% |
| Mean | 7.6% | 7.2% |
| Median | 4.7% | 4.7% |
| Interquartile 25% (IQ1) | 4.2% | 3.8% |
| Interquartile 75% (IQ3) | 10.4% | 7.0% |
| Interquartile Range (IQR) | 6.2% | 3.2% |
| Standard Deviation (Sample) | 6.0% | 8.4% |
| Standard Deviation (Population) | 5.9% | 8.2% |
Demographics Similar to Hungarians and Immigrants from Latvia by Unemployment Among Ages 45 to 54 years
In terms of unemployment among ages 45 to 54 years, the demographic groups most similar to Hungarians are Korean (4.5%, a difference of 0.010%), Immigrants from Spain (4.5%, a difference of 0.030%), Cypriot (4.5%, a difference of 0.090%), Tsimshian (4.5%, a difference of 0.10%), and Costa Rican (4.5%, a difference of 0.14%). Similarly, the demographic groups most similar to Immigrants from Latvia are Syrian (4.5%, a difference of 0.010%), Taiwanese (4.5%, a difference of 0.030%), Uruguayan (4.5%, a difference of 0.040%), Macedonian (4.5%, a difference of 0.11%), and Immigrants from Netherlands (4.4%, a difference of 0.14%).
| Demographics | Rating | Rank | Unemployment Among Ages 45 to 54 years |
| Immigrants | Kuwait | 81.7 /100 | #139 | Excellent 4.4% |
| Immigrants | Zaire | 80.7 /100 | #140 | Excellent 4.4% |
| Immigrants | Afghanistan | 79.6 /100 | #141 | Good 4.4% |
| Immigrants | Netherlands | 79.4 /100 | #142 | Good 4.4% |
| Macedonians | 79.0 /100 | #143 | Good 4.5% |
| Taiwanese | 77.9 /100 | #144 | Good 4.5% |
| Immigrants | Latvia | 77.5 /100 | #145 | Good 4.5% |
| Syrians | 77.3 /100 | #146 | Good 4.5% |
| Uruguayans | 76.9 /100 | #147 | Good 4.5% |
| Immigrants | Austria | 75.3 /100 | #148 | Good 4.5% |
| Costa Ricans | 75.3 /100 | #149 | Good 4.5% |
| Tsimshian | 74.6 /100 | #150 | Good 4.5% |
| Cypriots | 74.4 /100 | #151 | Good 4.5% |
| Koreans | 73.1 /100 | #152 | Good 4.5% |
| Hungarians | 73.0 /100 | #153 | Good 4.5% |
| Immigrants | Spain | 72.5 /100 | #154 | Good 4.5% |
| Marshallese | 70.6 /100 | #155 | Good 4.5% |
| Immigrants | Croatia | 69.6 /100 | #156 | Good 4.5% |
| Indians (Asian) | 68.1 /100 | #157 | Good 4.5% |
| Immigrants | Italy | 65.5 /100 | #158 | Good 4.5% |
| Immigrants | Nonimmigrants | 62.8 /100 | #159 | Good 4.5% |