Immigrants from Zaire vs Soviet Union Unemployment Among Ages 45 to 54 years
COMPARE
Immigrants from Zaire
Soviet Union
Unemployment Among Ages 45 to 54 years
Unemployment Among Ages 45 to 54 years Comparison
Immigrants from Zaire
Soviet Union
4.4%
UNEMPLOYMENT AMONG AGES 45 TO 54 YEARS
80.7/ 100
METRIC RATING
140th/ 347
METRIC RANK
4.7%
UNEMPLOYMENT AMONG AGES 45 TO 54 YEARS
2.6/ 100
METRIC RATING
234th/ 347
METRIC RANK
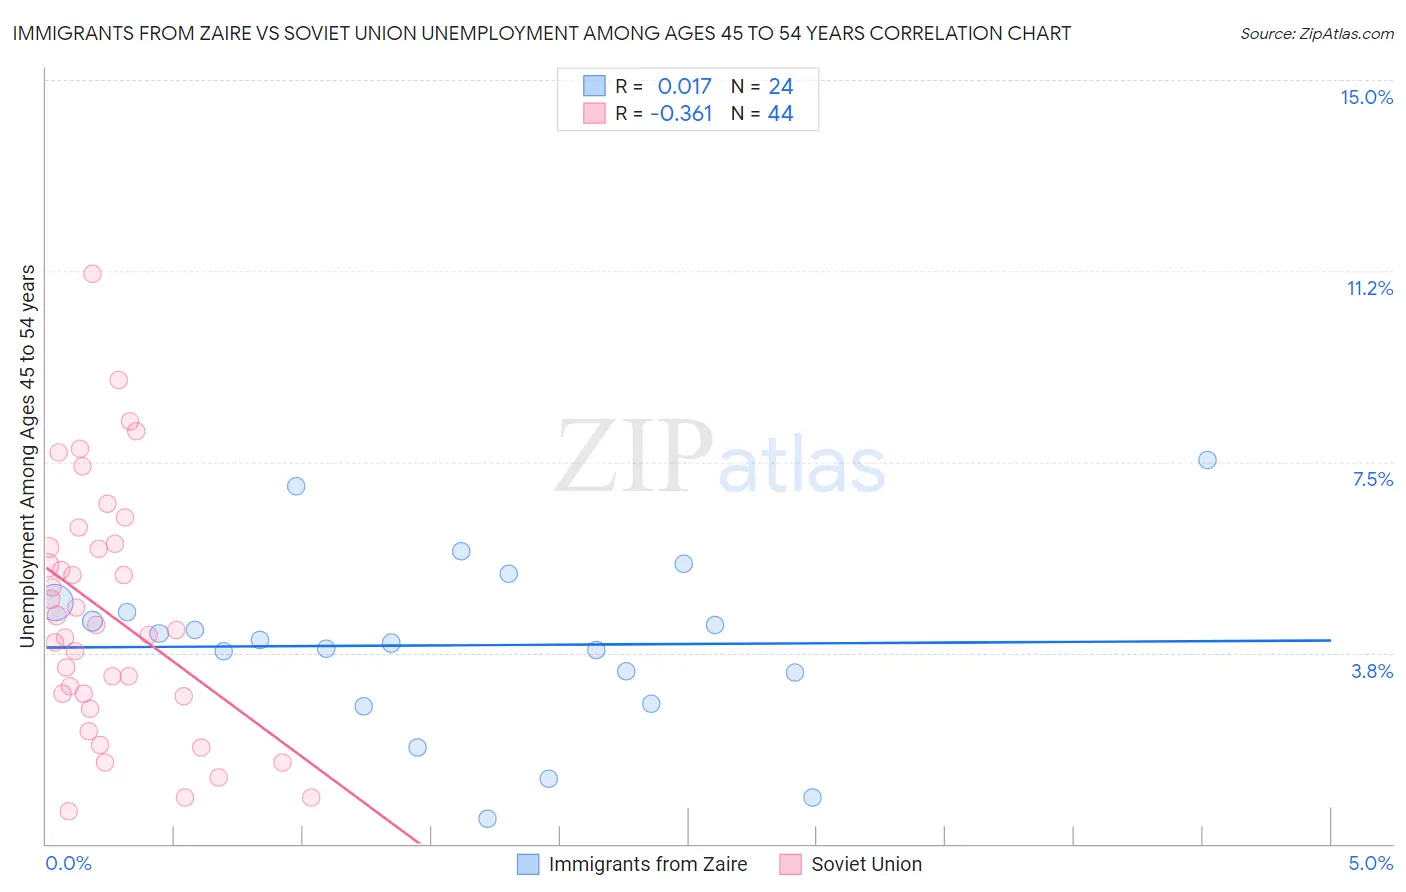
Immigrants from Zaire vs Soviet Union Unemployment Among Ages 45 to 54 years Correlation Chart
The statistical analysis conducted on geographies consisting of 106,544,284 people shows no correlation between the proportion of Immigrants from Zaire and unemployment rate among population between the ages 45 and 54 in the United States with a correlation coefficient (R) of 0.017 and weighted average of 4.4%. Similarly, the statistical analysis conducted on geographies consisting of 43,422,836 people shows a mild negative correlation between the proportion of Soviet Union and unemployment rate among population between the ages 45 and 54 in the United States with a correlation coefficient (R) of -0.361 and weighted average of 4.7%, a difference of 6.0%.
Unemployment Among Ages 45 to 54 years Correlation Summary
| Measurement | Immigrants from Zaire | Soviet Union |
| Minimum | 0.50% | 0.64% |
| Maximum | 7.5% | 11.2% |
| Range | 7.0% | 10.6% |
| Mean | 3.9% | 4.5% |
| Median | 4.0% | 4.3% |
| Interquartile 25% (IQ1) | 3.1% | 2.9% |
| Interquartile 75% (IQ3) | 4.7% | 5.9% |
| Interquartile Range (IQR) | 1.6% | 2.9% |
| Standard Deviation (Sample) | 1.7% | 2.4% |
| Standard Deviation (Population) | 1.7% | 2.4% |
Similar Demographics by Unemployment Among Ages 45 to 54 years
Demographics Similar to Immigrants from Zaire by Unemployment Among Ages 45 to 54 years
In terms of unemployment among ages 45 to 54 years, the demographic groups most similar to Immigrants from Zaire are Immigrants from Kuwait (4.4%, a difference of 0.080%), Immigrants from Afghanistan (4.4%, a difference of 0.080%), Immigrants from Congo (4.4%, a difference of 0.090%), Lebanese (4.4%, a difference of 0.10%), and Immigrants from Netherlands (4.4%, a difference of 0.10%).
| Demographics | Rating | Rank | Unemployment Among Ages 45 to 54 years |
| Immigrants | Cameroon | 84.8 /100 | #133 | Excellent 4.4% |
| Afghans | 84.6 /100 | #134 | Excellent 4.4% |
| Immigrants | Eastern Asia | 84.0 /100 | #135 | Excellent 4.4% |
| Immigrants | Middle Africa | 83.3 /100 | #136 | Excellent 4.4% |
| Lebanese | 81.9 /100 | #137 | Excellent 4.4% |
| Immigrants | Congo | 81.8 /100 | #138 | Excellent 4.4% |
| Immigrants | Kuwait | 81.7 /100 | #139 | Excellent 4.4% |
| Immigrants | Zaire | 80.7 /100 | #140 | Excellent 4.4% |
| Immigrants | Afghanistan | 79.6 /100 | #141 | Good 4.4% |
| Immigrants | Netherlands | 79.4 /100 | #142 | Good 4.4% |
| Macedonians | 79.0 /100 | #143 | Good 4.5% |
| Taiwanese | 77.9 /100 | #144 | Good 4.5% |
| Immigrants | Latvia | 77.5 /100 | #145 | Good 4.5% |
| Syrians | 77.3 /100 | #146 | Good 4.5% |
| Uruguayans | 76.9 /100 | #147 | Good 4.5% |
Demographics Similar to Soviet Union by Unemployment Among Ages 45 to 54 years
In terms of unemployment among ages 45 to 54 years, the demographic groups most similar to Soviet Union are Immigrants (4.7%, a difference of 0.020%), Immigrants from Ireland (4.7%, a difference of 0.060%), Ottawa (4.7%, a difference of 0.060%), Japanese (4.7%, a difference of 0.10%), and Cree (4.7%, a difference of 0.15%).
| Demographics | Rating | Rank | Unemployment Among Ages 45 to 54 years |
| Iraqis | 3.2 /100 | #227 | Tragic 4.7% |
| South American Indians | 3.1 /100 | #228 | Tragic 4.7% |
| Immigrants | Israel | 3.0 /100 | #229 | Tragic 4.7% |
| Japanese | 2.8 /100 | #230 | Tragic 4.7% |
| Immigrants | Ireland | 2.7 /100 | #231 | Tragic 4.7% |
| Ottawa | 2.7 /100 | #232 | Tragic 4.7% |
| Immigrants | Immigrants | 2.6 /100 | #233 | Tragic 4.7% |
| Soviet Union | 2.6 /100 | #234 | Tragic 4.7% |
| Cree | 2.3 /100 | #235 | Tragic 4.7% |
| Tlingit-Haida | 2.3 /100 | #236 | Tragic 4.7% |
| Alsatians | 1.6 /100 | #237 | Tragic 4.7% |
| Yaqui | 1.4 /100 | #238 | Tragic 4.7% |
| Spanish Americans | 1.4 /100 | #239 | Tragic 4.7% |
| Immigrants | Iraq | 1.3 /100 | #240 | Tragic 4.7% |
| Delaware | 1.3 /100 | #241 | Tragic 4.8% |