Immigrants from Western Europe vs Hungarian High School Diploma
COMPARE
Immigrants from Western Europe
Hungarian
High School Diploma
High School Diploma Comparison
Immigrants from Western Europe
Hungarians
90.6%
HIGH SCHOOL DIPLOMA
98.6/ 100
METRIC RATING
93rd/ 347
METRIC RANK
90.8%
HIGH SCHOOL DIPLOMA
99.3/ 100
METRIC RATING
76th/ 347
METRIC RANK
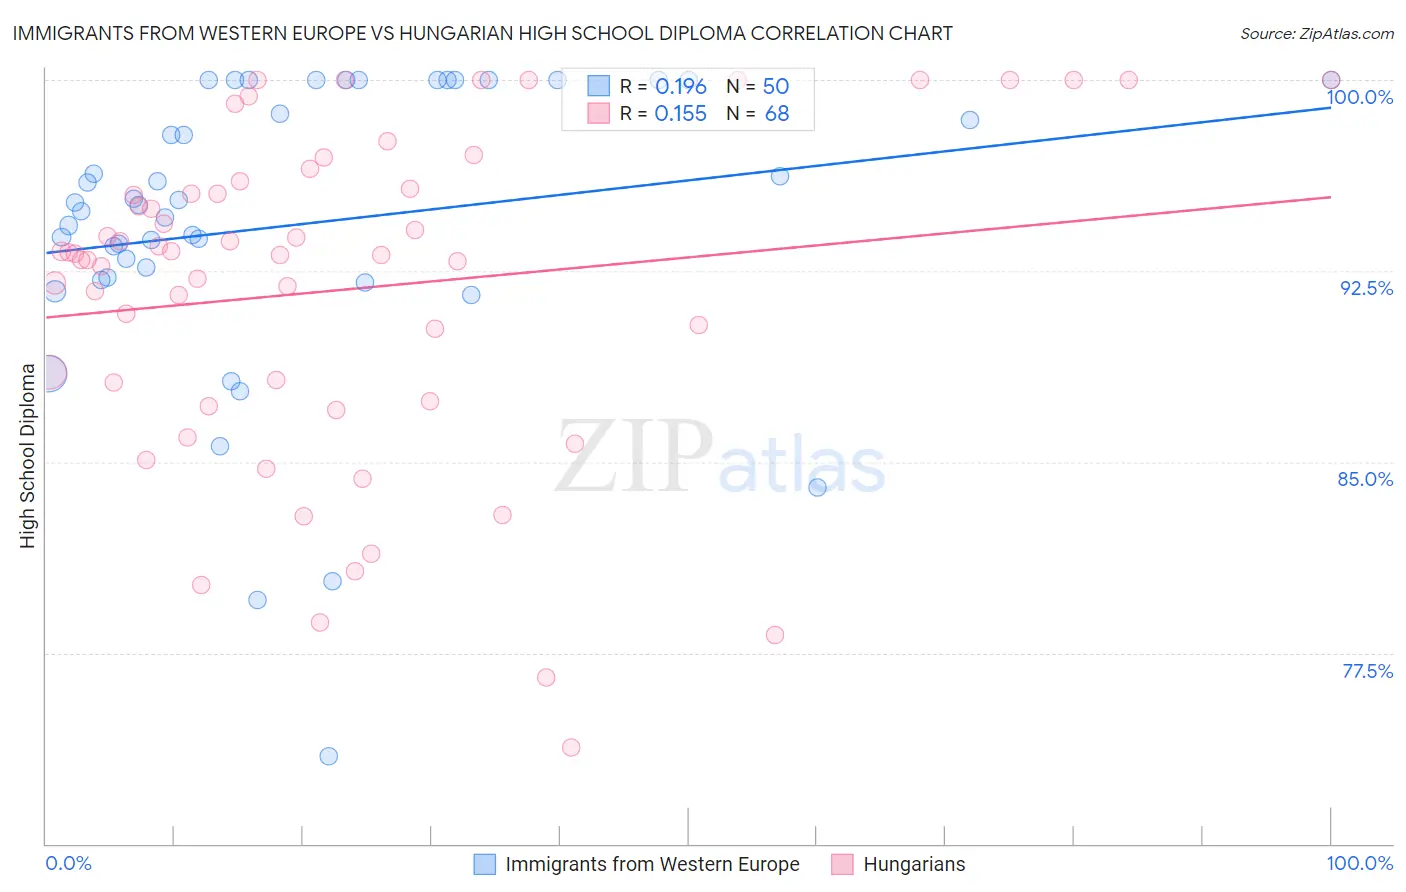
Immigrants from Western Europe vs Hungarian High School Diploma Correlation Chart
The statistical analysis conducted on geographies consisting of 494,080,377 people shows a poor positive correlation between the proportion of Immigrants from Western Europe and percentage of population with at least high school diploma education in the United States with a correlation coefficient (R) of 0.196 and weighted average of 90.6%. Similarly, the statistical analysis conducted on geographies consisting of 486,240,766 people shows a poor positive correlation between the proportion of Hungarians and percentage of population with at least high school diploma education in the United States with a correlation coefficient (R) of 0.155 and weighted average of 90.8%, a difference of 0.29%.
High School Diploma Correlation Summary
| Measurement | Immigrants from Western Europe | Hungarian |
| Minimum | 73.4% | 73.8% |
| Maximum | 100.0% | 100.0% |
| Range | 26.6% | 26.2% |
| Mean | 94.3% | 91.8% |
| Median | 95.1% | 93.2% |
| Interquartile 25% (IQ1) | 92.3% | 87.8% |
| Interquartile 75% (IQ3) | 100.0% | 95.9% |
| Interquartile Range (IQR) | 7.7% | 8.1% |
| Standard Deviation (Sample) | 5.9% | 6.5% |
| Standard Deviation (Population) | 5.9% | 6.4% |
Demographics Similar to Immigrants from Western Europe and Hungarians by High School Diploma
In terms of high school diploma, the demographic groups most similar to Immigrants from Western Europe are Swiss (90.6%, a difference of 0.0%), South African (90.6%, a difference of 0.020%), Immigrants from Israel (90.5%, a difference of 0.020%), Canadian (90.6%, a difference of 0.040%), and Celtic (90.6%, a difference of 0.040%). Similarly, the demographic groups most similar to Hungarians are Cambodian (90.8%, a difference of 0.010%), Native Hawaiian (90.8%, a difference of 0.010%), Burmese (90.8%, a difference of 0.010%), Immigrants from Denmark (90.8%, a difference of 0.020%), and Immigrants from Czechoslovakia (90.9%, a difference of 0.030%).
| Demographics | Rating | Rank | High School Diploma |
| Immigrants | Czechoslovakia | 99.4 /100 | #74 | Exceptional 90.9% |
| Cambodians | 99.4 /100 | #75 | Exceptional 90.8% |
| Hungarians | 99.3 /100 | #76 | Exceptional 90.8% |
| Native Hawaiians | 99.3 /100 | #77 | Exceptional 90.8% |
| Burmese | 99.3 /100 | #78 | Exceptional 90.8% |
| Immigrants | Denmark | 99.3 /100 | #79 | Exceptional 90.8% |
| Immigrants | England | 99.3 /100 | #80 | Exceptional 90.8% |
| Immigrants | Switzerland | 99.3 /100 | #81 | Exceptional 90.8% |
| Scotch-Irish | 99.2 /100 | #82 | Exceptional 90.8% |
| Immigrants | Moldova | 99.2 /100 | #83 | Exceptional 90.7% |
| Immigrants | Saudi Arabia | 99.1 /100 | #84 | Exceptional 90.7% |
| Romanians | 98.9 /100 | #85 | Exceptional 90.7% |
| Immigrants | Bulgaria | 98.9 /100 | #86 | Exceptional 90.6% |
| Immigrants | Turkey | 98.9 /100 | #87 | Exceptional 90.6% |
| Immigrants | France | 98.8 /100 | #88 | Exceptional 90.6% |
| Canadians | 98.7 /100 | #89 | Exceptional 90.6% |
| Celtics | 98.7 /100 | #90 | Exceptional 90.6% |
| South Africans | 98.6 /100 | #91 | Exceptional 90.6% |
| Swiss | 98.6 /100 | #92 | Exceptional 90.6% |
| Immigrants | Western Europe | 98.6 /100 | #93 | Exceptional 90.6% |
| Immigrants | Israel | 98.5 /100 | #94 | Exceptional 90.5% |