Immigrants from Western Asia vs Russian Male Unemployment
COMPARE
Immigrants from Western Asia
Russian
Male Unemployment
Male Unemployment Comparison
Immigrants from Western Asia
Russians
5.6%
MALE UNEMPLOYMENT
3.5/ 100
METRIC RATING
219th/ 347
METRIC RANK
5.1%
MALE UNEMPLOYMENT
92.9/ 100
METRIC RATING
100th/ 347
METRIC RANK
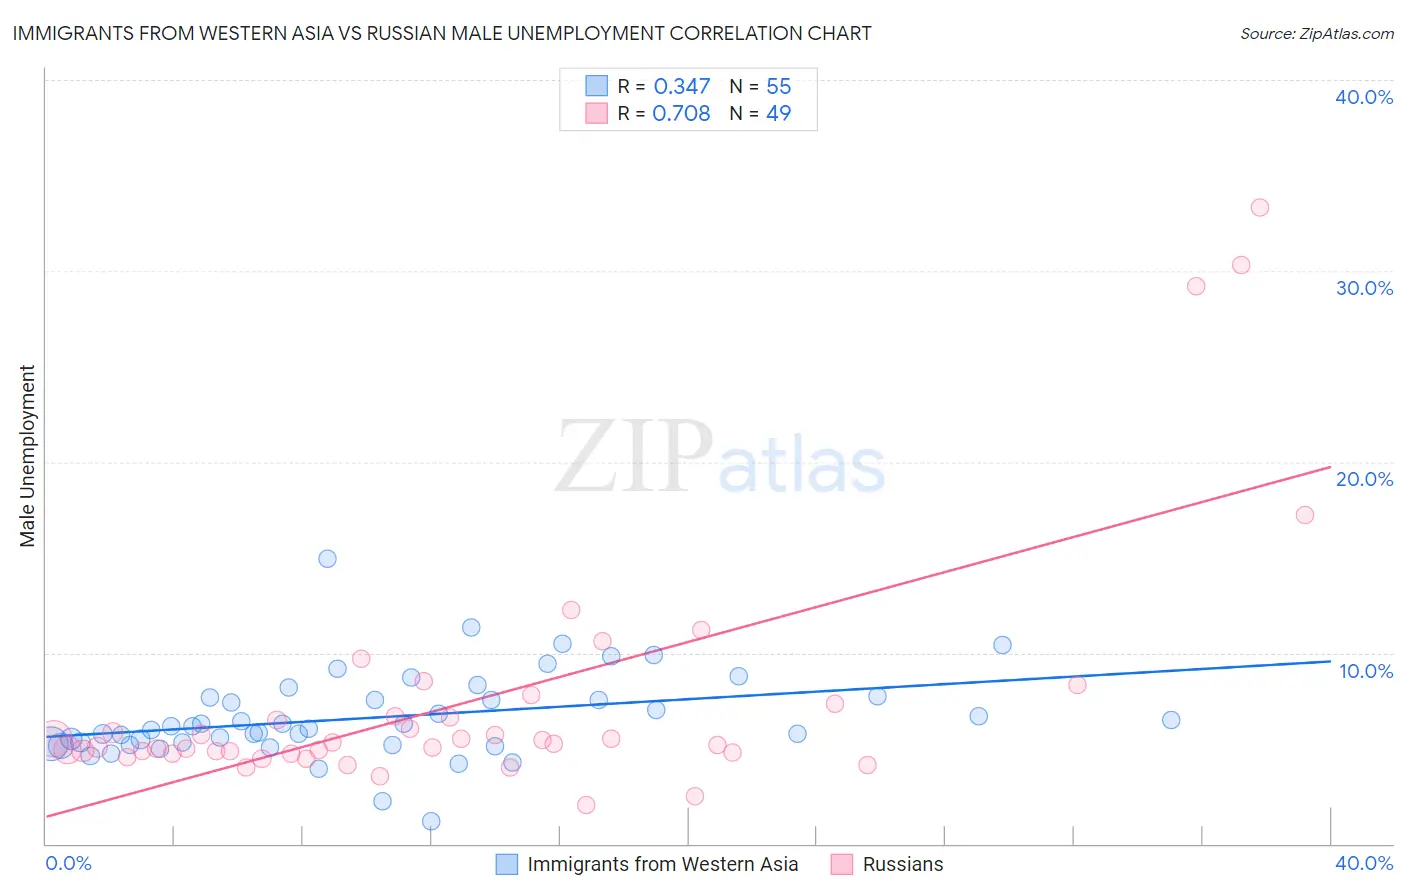
Immigrants from Western Asia vs Russian Male Unemployment Correlation Chart
The statistical analysis conducted on geographies consisting of 403,036,222 people shows a mild positive correlation between the proportion of Immigrants from Western Asia and unemployment rate among males in the United States with a correlation coefficient (R) of 0.347 and weighted average of 5.6%. Similarly, the statistical analysis conducted on geographies consisting of 506,887,579 people shows a strong positive correlation between the proportion of Russians and unemployment rate among males in the United States with a correlation coefficient (R) of 0.708 and weighted average of 5.1%, a difference of 8.9%.
Male Unemployment Correlation Summary
| Measurement | Immigrants from Western Asia | Russian |
| Minimum | 1.2% | 2.0% |
| Maximum | 14.9% | 33.3% |
| Range | 13.7% | 31.3% |
| Mean | 6.6% | 7.5% |
| Median | 6.1% | 5.2% |
| Interquartile 25% (IQ1) | 5.2% | 4.8% |
| Interquartile 75% (IQ3) | 7.6% | 7.0% |
| Interquartile Range (IQR) | 2.4% | 2.2% |
| Standard Deviation (Sample) | 2.3% | 6.6% |
| Standard Deviation (Population) | 2.3% | 6.5% |
Similar Demographics by Male Unemployment
Demographics Similar to Immigrants from Western Asia by Male Unemployment
In terms of male unemployment, the demographic groups most similar to Immigrants from Western Asia are Portuguese (5.6%, a difference of 0.030%), Immigrants from Albania (5.5%, a difference of 0.050%), Soviet Union (5.6%, a difference of 0.13%), Delaware (5.5%, a difference of 0.25%), and Immigrants from Micronesia (5.6%, a difference of 0.27%).
| Demographics | Rating | Rank | Male Unemployment |
| Hmong | 7.0 /100 | #212 | Tragic 5.5% |
| Ugandans | 6.3 /100 | #213 | Tragic 5.5% |
| Puget Sound Salish | 5.6 /100 | #214 | Tragic 5.5% |
| Samoans | 4.9 /100 | #215 | Tragic 5.5% |
| Immigrants | Immigrants | 4.3 /100 | #216 | Tragic 5.5% |
| Delaware | 4.2 /100 | #217 | Tragic 5.5% |
| Immigrants | Albania | 3.6 /100 | #218 | Tragic 5.5% |
| Immigrants | Western Asia | 3.5 /100 | #219 | Tragic 5.6% |
| Portuguese | 3.5 /100 | #220 | Tragic 5.6% |
| Soviet Union | 3.2 /100 | #221 | Tragic 5.6% |
| Immigrants | Micronesia | 2.9 /100 | #222 | Tragic 5.6% |
| Creek | 2.6 /100 | #223 | Tragic 5.6% |
| Cherokee | 2.4 /100 | #224 | Tragic 5.6% |
| Panamanians | 1.9 /100 | #225 | Tragic 5.6% |
| Immigrants | Cambodia | 1.8 /100 | #226 | Tragic 5.6% |
Demographics Similar to Russians by Male Unemployment
In terms of male unemployment, the demographic groups most similar to Russians are Uruguayan (5.1%, a difference of 0.020%), German Russian (5.1%, a difference of 0.040%), Immigrants from France (5.1%, a difference of 0.060%), Immigrants from Kuwait (5.1%, a difference of 0.080%), and Immigrants from Spain (5.1%, a difference of 0.12%).
| Demographics | Rating | Rank | Male Unemployment |
| Immigrants | Serbia | 94.2 /100 | #93 | Exceptional 5.1% |
| Canadians | 94.1 /100 | #94 | Exceptional 5.1% |
| Italians | 93.8 /100 | #95 | Exceptional 5.1% |
| Asians | 93.7 /100 | #96 | Exceptional 5.1% |
| Immigrants | Spain | 93.4 /100 | #97 | Exceptional 5.1% |
| Immigrants | Kuwait | 93.3 /100 | #98 | Exceptional 5.1% |
| Uruguayans | 93.0 /100 | #99 | Exceptional 5.1% |
| Russians | 92.9 /100 | #100 | Exceptional 5.1% |
| German Russians | 92.7 /100 | #101 | Exceptional 5.1% |
| Immigrants | France | 92.7 /100 | #102 | Exceptional 5.1% |
| Immigrants | Jordan | 91.9 /100 | #103 | Exceptional 5.1% |
| Immigrants | Chile | 91.8 /100 | #104 | Exceptional 5.1% |
| Immigrants | Czechoslovakia | 91.7 /100 | #105 | Exceptional 5.1% |
| Immigrants | Ethiopia | 91.5 /100 | #106 | Exceptional 5.1% |
| Ethiopians | 91.3 /100 | #107 | Exceptional 5.1% |