Immigrants from Vietnam vs Seminole Unemployment Among Women with Children Ages 6 to 17 years
COMPARE
Immigrants from Vietnam
Seminole
Unemployment Among Women with Children Ages 6 to 17 years
Unemployment Among Women with Children Ages 6 to 17 years Comparison
Immigrants from Vietnam
Seminole
8.5%
UNEMPLOYMENT AMONG WOMEN WITH CHILDREN AGES 6 TO 17 YEARS
99.1/ 100
METRIC RATING
88th/ 347
METRIC RANK
9.7%
UNEMPLOYMENT AMONG WOMEN WITH CHILDREN AGES 6 TO 17 YEARS
0.1/ 100
METRIC RATING
280th/ 347
METRIC RANK
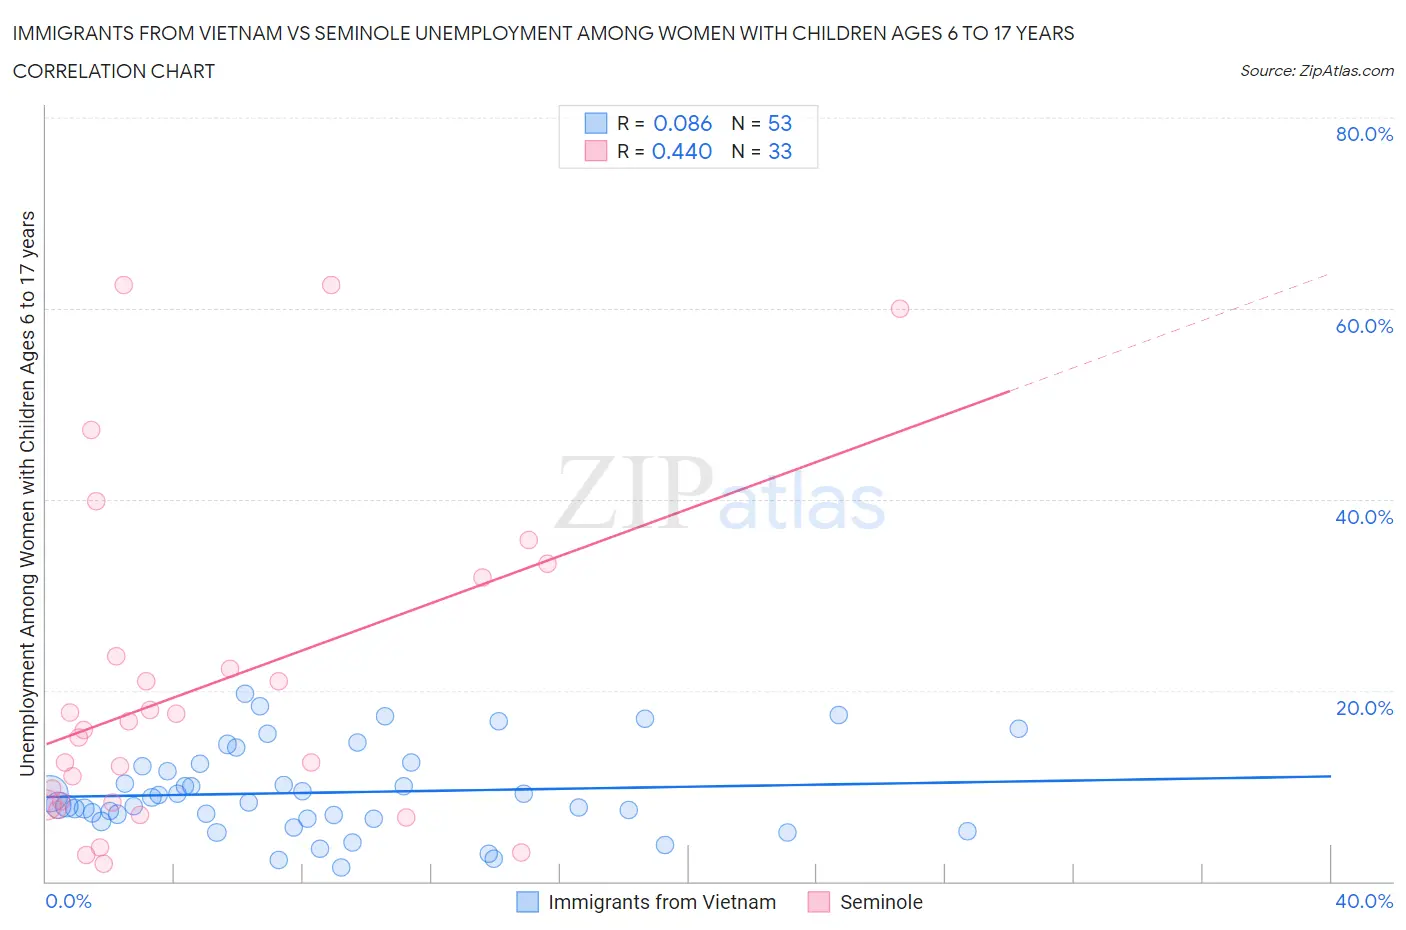
Immigrants from Vietnam vs Seminole Unemployment Among Women with Children Ages 6 to 17 years Correlation Chart
The statistical analysis conducted on geographies consisting of 294,165,935 people shows a slight positive correlation between the proportion of Immigrants from Vietnam and unemployment rate among women with children between the ages 6 and 17 in the United States with a correlation coefficient (R) of 0.086 and weighted average of 8.5%. Similarly, the statistical analysis conducted on geographies consisting of 102,585,790 people shows a moderate positive correlation between the proportion of Seminole and unemployment rate among women with children between the ages 6 and 17 in the United States with a correlation coefficient (R) of 0.440 and weighted average of 9.7%, a difference of 14.4%.
Unemployment Among Women with Children Ages 6 to 17 years Correlation Summary
| Measurement | Immigrants from Vietnam | Seminole |
| Minimum | 1.4% | 1.8% |
| Maximum | 19.7% | 62.5% |
| Range | 18.3% | 60.7% |
| Mean | 9.3% | 20.5% |
| Median | 8.2% | 15.9% |
| Interquartile 25% (IQ1) | 6.6% | 8.2% |
| Interquartile 75% (IQ3) | 12.2% | 27.7% |
| Interquartile Range (IQR) | 5.7% | 19.5% |
| Standard Deviation (Sample) | 4.5% | 17.2% |
| Standard Deviation (Population) | 4.5% | 16.9% |
Similar Demographics by Unemployment Among Women with Children Ages 6 to 17 years
Demographics Similar to Immigrants from Vietnam by Unemployment Among Women with Children Ages 6 to 17 years
In terms of unemployment among women with children ages 6 to 17 years, the demographic groups most similar to Immigrants from Vietnam are Immigrants from Israel (8.5%, a difference of 0.020%), Paiute (8.5%, a difference of 0.080%), Yugoslavian (8.5%, a difference of 0.12%), Immigrants from Eastern Europe (8.5%, a difference of 0.18%), and Potawatomi (8.5%, a difference of 0.21%).
| Demographics | Rating | Rank | Unemployment Among Women with Children Ages 6 to 17 years |
| Immigrants | Bolivia | 99.6 /100 | #81 | Exceptional 8.4% |
| Cypriots | 99.6 /100 | #82 | Exceptional 8.4% |
| Bulgarians | 99.5 /100 | #83 | Exceptional 8.4% |
| Japanese | 99.5 /100 | #84 | Exceptional 8.4% |
| Immigrants | North Macedonia | 99.4 /100 | #85 | Exceptional 8.5% |
| Alaskan Athabascans | 99.4 /100 | #86 | Exceptional 8.5% |
| Immigrants | Israel | 99.1 /100 | #87 | Exceptional 8.5% |
| Immigrants | Vietnam | 99.1 /100 | #88 | Exceptional 8.5% |
| Paiute | 99.1 /100 | #89 | Exceptional 8.5% |
| Yugoslavians | 99.0 /100 | #90 | Exceptional 8.5% |
| Immigrants | Eastern Europe | 99.0 /100 | #91 | Exceptional 8.5% |
| Potawatomi | 99.0 /100 | #92 | Exceptional 8.5% |
| Australians | 98.9 /100 | #93 | Exceptional 8.5% |
| Immigrants | Barbados | 98.8 /100 | #94 | Exceptional 8.5% |
| Sri Lankans | 98.7 /100 | #95 | Exceptional 8.5% |
Demographics Similar to Seminole by Unemployment Among Women with Children Ages 6 to 17 years
In terms of unemployment among women with children ages 6 to 17 years, the demographic groups most similar to Seminole are Scotch-Irish (9.7%, a difference of 0.19%), French (9.7%, a difference of 0.22%), British West Indian (9.7%, a difference of 0.29%), Immigrants from Portugal (9.7%, a difference of 0.35%), and U.S. Virgin Islander (9.7%, a difference of 0.36%).
| Demographics | Rating | Rank | Unemployment Among Women with Children Ages 6 to 17 years |
| Whites/Caucasians | 0.1 /100 | #273 | Tragic 9.6% |
| Aleuts | 0.1 /100 | #274 | Tragic 9.6% |
| U.S. Virgin Islanders | 0.1 /100 | #275 | Tragic 9.7% |
| Immigrants | Portugal | 0.1 /100 | #276 | Tragic 9.7% |
| British West Indians | 0.1 /100 | #277 | Tragic 9.7% |
| French | 0.1 /100 | #278 | Tragic 9.7% |
| Scotch-Irish | 0.1 /100 | #279 | Tragic 9.7% |
| Seminole | 0.1 /100 | #280 | Tragic 9.7% |
| Jamaicans | 0.0 /100 | #281 | Tragic 9.8% |
| Slovaks | 0.0 /100 | #282 | Tragic 9.8% |
| Central American Indians | 0.0 /100 | #283 | Tragic 9.9% |
| Yakama | 0.0 /100 | #284 | Tragic 9.9% |
| Hispanics or Latinos | 0.0 /100 | #285 | Tragic 9.9% |
| Choctaw | 0.0 /100 | #286 | Tragic 9.9% |
| Sierra Leoneans | 0.0 /100 | #287 | Tragic 9.9% |