Immigrants from Vietnam vs Immigrants from Northern Africa Unemployment Among Women with Children Ages 6 to 17 years
COMPARE
Immigrants from Vietnam
Immigrants from Northern Africa
Unemployment Among Women with Children Ages 6 to 17 years
Unemployment Among Women with Children Ages 6 to 17 years Comparison
Immigrants from Vietnam
Immigrants from Northern Africa
8.5%
UNEMPLOYMENT AMONG WOMEN WITH CHILDREN AGES 6 TO 17 YEARS
99.1/ 100
METRIC RATING
88th/ 347
METRIC RANK
8.7%
UNEMPLOYMENT AMONG WOMEN WITH CHILDREN AGES 6 TO 17 YEARS
94.4/ 100
METRIC RATING
126th/ 347
METRIC RANK
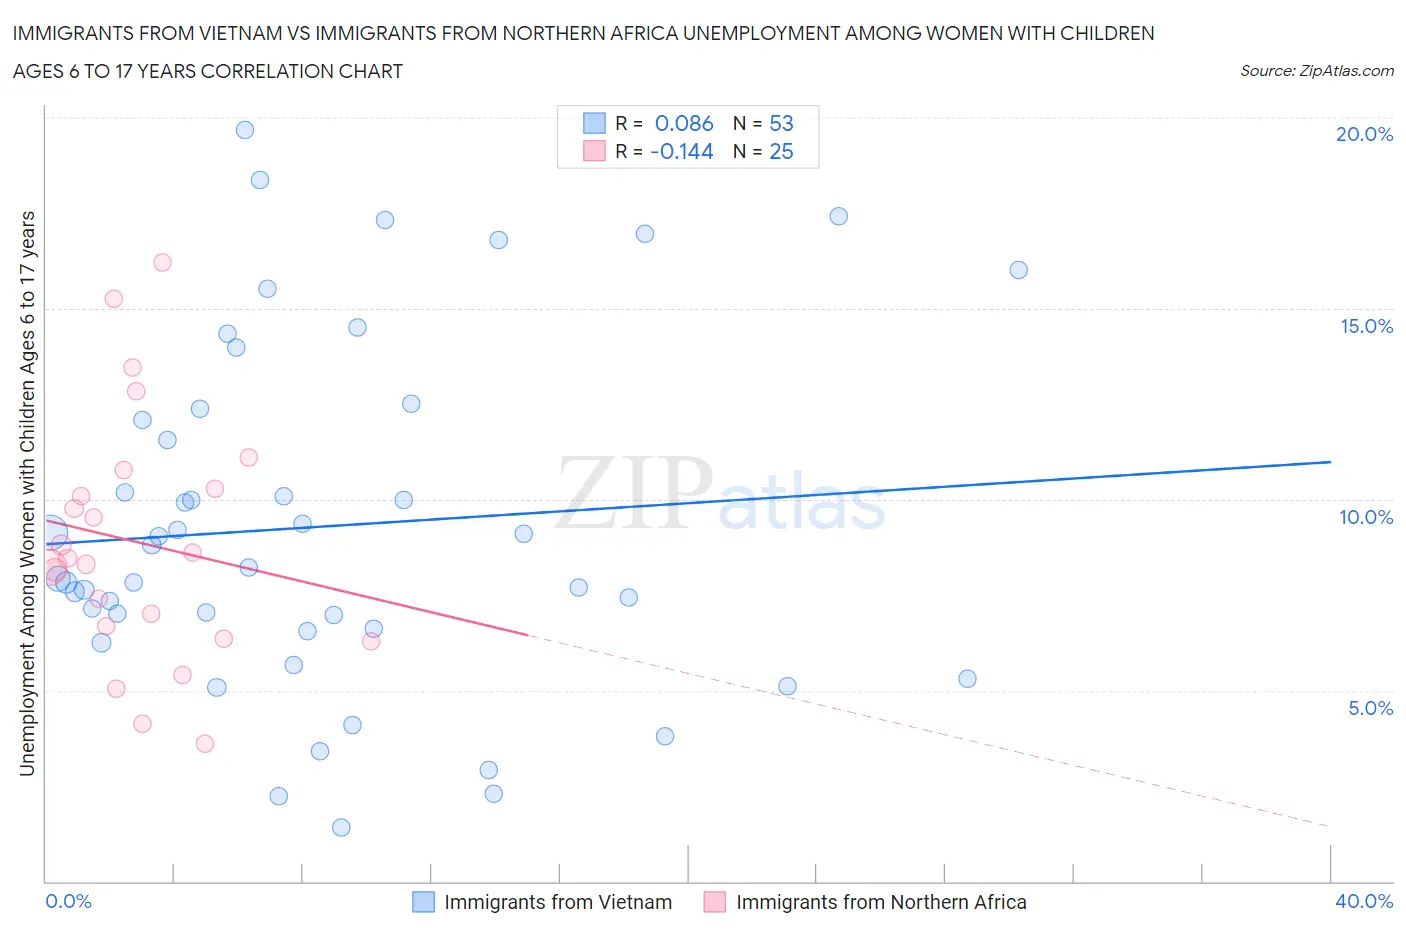
Immigrants from Vietnam vs Immigrants from Northern Africa Unemployment Among Women with Children Ages 6 to 17 years Correlation Chart
The statistical analysis conducted on geographies consisting of 294,165,935 people shows a slight positive correlation between the proportion of Immigrants from Vietnam and unemployment rate among women with children between the ages 6 and 17 in the United States with a correlation coefficient (R) of 0.086 and weighted average of 8.5%. Similarly, the statistical analysis conducted on geographies consisting of 243,403,953 people shows a poor negative correlation between the proportion of Immigrants from Northern Africa and unemployment rate among women with children between the ages 6 and 17 in the United States with a correlation coefficient (R) of -0.144 and weighted average of 8.7%, a difference of 2.2%.
Unemployment Among Women with Children Ages 6 to 17 years Correlation Summary
| Measurement | Immigrants from Vietnam | Immigrants from Northern Africa |
| Minimum | 1.4% | 3.6% |
| Maximum | 19.7% | 16.2% |
| Range | 18.3% | 12.6% |
| Mean | 9.3% | 8.9% |
| Median | 8.2% | 8.5% |
| Interquartile 25% (IQ1) | 6.6% | 6.5% |
| Interquartile 75% (IQ3) | 12.2% | 10.5% |
| Interquartile Range (IQR) | 5.7% | 4.0% |
| Standard Deviation (Sample) | 4.5% | 3.2% |
| Standard Deviation (Population) | 4.5% | 3.1% |
Similar Demographics by Unemployment Among Women with Children Ages 6 to 17 years
Demographics Similar to Immigrants from Vietnam by Unemployment Among Women with Children Ages 6 to 17 years
In terms of unemployment among women with children ages 6 to 17 years, the demographic groups most similar to Immigrants from Vietnam are Immigrants from Israel (8.5%, a difference of 0.020%), Paiute (8.5%, a difference of 0.080%), Yugoslavian (8.5%, a difference of 0.12%), Immigrants from Eastern Europe (8.5%, a difference of 0.18%), and Potawatomi (8.5%, a difference of 0.21%).
| Demographics | Rating | Rank | Unemployment Among Women with Children Ages 6 to 17 years |
| Immigrants | Bolivia | 99.6 /100 | #81 | Exceptional 8.4% |
| Cypriots | 99.6 /100 | #82 | Exceptional 8.4% |
| Bulgarians | 99.5 /100 | #83 | Exceptional 8.4% |
| Japanese | 99.5 /100 | #84 | Exceptional 8.4% |
| Immigrants | North Macedonia | 99.4 /100 | #85 | Exceptional 8.5% |
| Alaskan Athabascans | 99.4 /100 | #86 | Exceptional 8.5% |
| Immigrants | Israel | 99.1 /100 | #87 | Exceptional 8.5% |
| Immigrants | Vietnam | 99.1 /100 | #88 | Exceptional 8.5% |
| Paiute | 99.1 /100 | #89 | Exceptional 8.5% |
| Yugoslavians | 99.0 /100 | #90 | Exceptional 8.5% |
| Immigrants | Eastern Europe | 99.0 /100 | #91 | Exceptional 8.5% |
| Potawatomi | 99.0 /100 | #92 | Exceptional 8.5% |
| Australians | 98.9 /100 | #93 | Exceptional 8.5% |
| Immigrants | Barbados | 98.8 /100 | #94 | Exceptional 8.5% |
| Sri Lankans | 98.7 /100 | #95 | Exceptional 8.5% |
Demographics Similar to Immigrants from Northern Africa by Unemployment Among Women with Children Ages 6 to 17 years
In terms of unemployment among women with children ages 6 to 17 years, the demographic groups most similar to Immigrants from Northern Africa are Czech (8.7%, a difference of 0.010%), South African (8.7%, a difference of 0.030%), Hmong (8.7%, a difference of 0.030%), Immigrants from Morocco (8.7%, a difference of 0.10%), and Immigrants from Lebanon (8.7%, a difference of 0.10%).
| Demographics | Rating | Rank | Unemployment Among Women with Children Ages 6 to 17 years |
| Immigrants | Grenada | 96.2 /100 | #119 | Exceptional 8.6% |
| Israelis | 95.9 /100 | #120 | Exceptional 8.7% |
| Immigrants | Denmark | 95.5 /100 | #121 | Exceptional 8.7% |
| Immigrants | Egypt | 95.0 /100 | #122 | Exceptional 8.7% |
| Immigrants | Morocco | 94.9 /100 | #123 | Exceptional 8.7% |
| Immigrants | Lebanon | 94.9 /100 | #124 | Exceptional 8.7% |
| South Africans | 94.6 /100 | #125 | Exceptional 8.7% |
| Immigrants | Northern Africa | 94.4 /100 | #126 | Exceptional 8.7% |
| Czechs | 94.4 /100 | #127 | Exceptional 8.7% |
| Hmong | 94.3 /100 | #128 | Exceptional 8.7% |
| Barbadians | 93.8 /100 | #129 | Exceptional 8.7% |
| Immigrants | Western Asia | 93.1 /100 | #130 | Exceptional 8.7% |
| Slavs | 92.2 /100 | #131 | Exceptional 8.7% |
| Yaqui | 92.2 /100 | #132 | Exceptional 8.7% |
| Egyptians | 91.8 /100 | #133 | Exceptional 8.7% |