Immigrants from Ukraine vs Immigrants from South Central Asia Unemployment Among Women with Children Ages 6 to 17 years
COMPARE
Immigrants from Ukraine
Immigrants from South Central Asia
Unemployment Among Women with Children Ages 6 to 17 years
Unemployment Among Women with Children Ages 6 to 17 years Comparison
Immigrants from Ukraine
Immigrants from South Central Asia
8.6%
UNEMPLOYMENT AMONG WOMEN WITH CHILDREN AGES 6 TO 17 YEARS
97.4/ 100
METRIC RATING
111th/ 347
METRIC RANK
7.9%
UNEMPLOYMENT AMONG WOMEN WITH CHILDREN AGES 6 TO 17 YEARS
100.0/ 100
METRIC RATING
35th/ 347
METRIC RANK
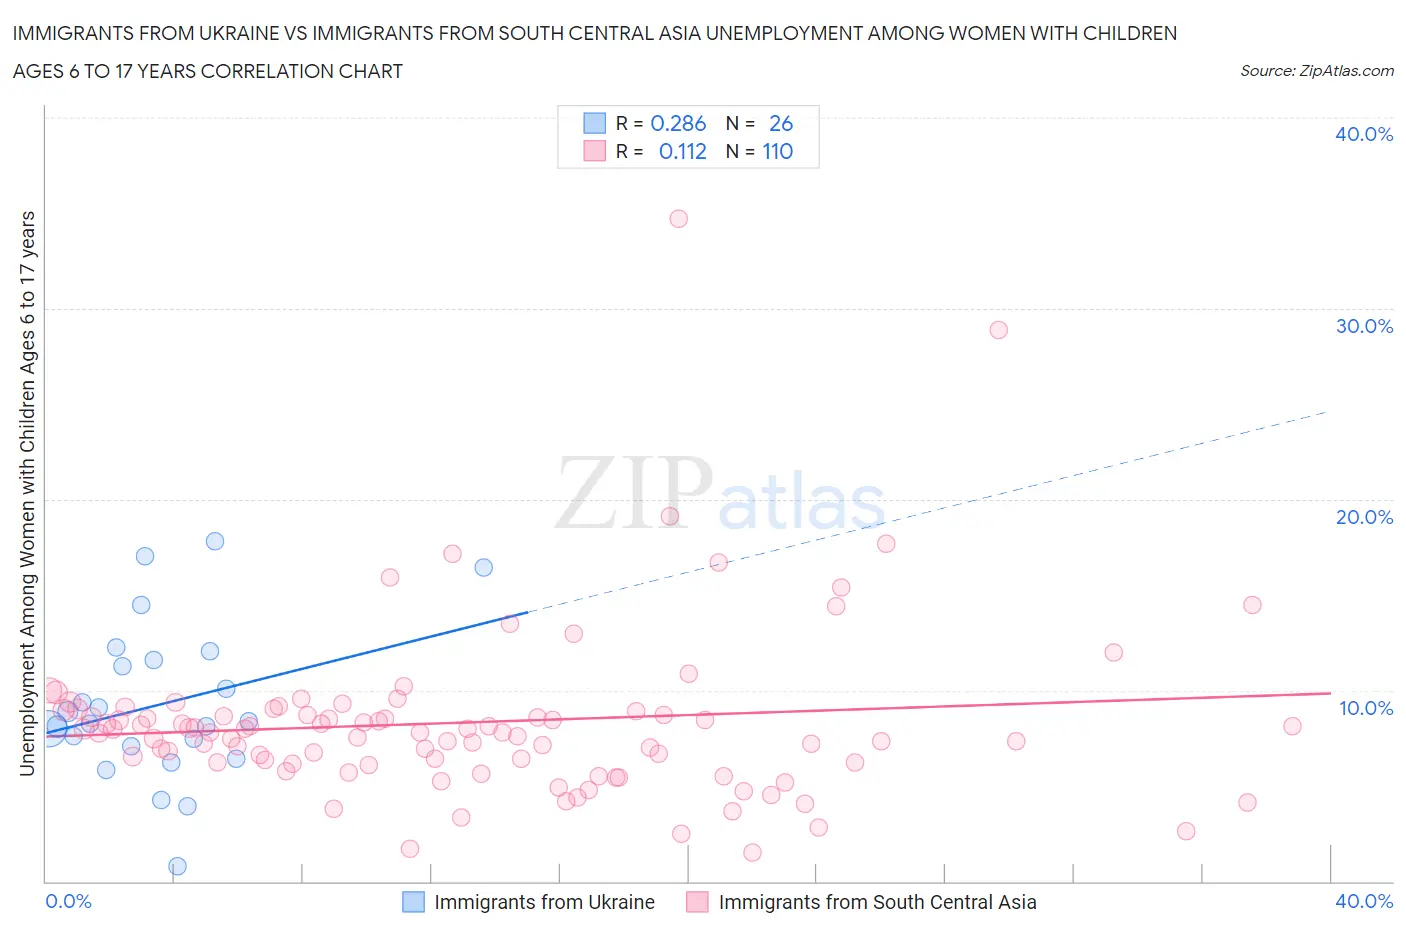
Immigrants from Ukraine vs Immigrants from South Central Asia Unemployment Among Women with Children Ages 6 to 17 years Correlation Chart
The statistical analysis conducted on geographies consisting of 215,687,583 people shows a weak positive correlation between the proportion of Immigrants from Ukraine and unemployment rate among women with children between the ages 6 and 17 in the United States with a correlation coefficient (R) of 0.286 and weighted average of 8.6%. Similarly, the statistical analysis conducted on geographies consisting of 326,255,607 people shows a poor positive correlation between the proportion of Immigrants from South Central Asia and unemployment rate among women with children between the ages 6 and 17 in the United States with a correlation coefficient (R) of 0.112 and weighted average of 7.9%, a difference of 8.2%.
Unemployment Among Women with Children Ages 6 to 17 years Correlation Summary
| Measurement | Immigrants from Ukraine | Immigrants from South Central Asia |
| Minimum | 0.80% | 1.5% |
| Maximum | 17.8% | 34.7% |
| Range | 17.0% | 33.2% |
| Mean | 9.3% | 8.3% |
| Median | 8.3% | 7.8% |
| Interquartile 25% (IQ1) | 7.1% | 6.2% |
| Interquartile 75% (IQ3) | 11.6% | 8.9% |
| Interquartile Range (IQR) | 4.5% | 2.7% |
| Standard Deviation (Sample) | 4.0% | 4.5% |
| Standard Deviation (Population) | 4.0% | 4.5% |
Similar Demographics by Unemployment Among Women with Children Ages 6 to 17 years
Demographics Similar to Immigrants from Ukraine by Unemployment Among Women with Children Ages 6 to 17 years
In terms of unemployment among women with children ages 6 to 17 years, the demographic groups most similar to Immigrants from Ukraine are Latvian (8.6%, a difference of 0.010%), Immigrants from Romania (8.6%, a difference of 0.020%), Swedish (8.6%, a difference of 0.090%), Chickasaw (8.6%, a difference of 0.10%), and Romanian (8.6%, a difference of 0.12%).
| Demographics | Rating | Rank | Unemployment Among Women with Children Ages 6 to 17 years |
| Immigrants | France | 98.0 /100 | #104 | Exceptional 8.6% |
| Immigrants | Norway | 97.8 /100 | #105 | Exceptional 8.6% |
| Immigrants | Serbia | 97.7 /100 | #106 | Exceptional 8.6% |
| Chickasaw | 97.6 /100 | #107 | Exceptional 8.6% |
| Swedes | 97.6 /100 | #108 | Exceptional 8.6% |
| Immigrants | Romania | 97.5 /100 | #109 | Exceptional 8.6% |
| Latvians | 97.4 /100 | #110 | Exceptional 8.6% |
| Immigrants | Ukraine | 97.4 /100 | #111 | Exceptional 8.6% |
| Romanians | 97.1 /100 | #112 | Exceptional 8.6% |
| Eastern Europeans | 96.8 /100 | #113 | Exceptional 8.6% |
| Immigrants | Russia | 96.7 /100 | #114 | Exceptional 8.6% |
| Argentineans | 96.5 /100 | #115 | Exceptional 8.6% |
| Zimbabweans | 96.3 /100 | #116 | Exceptional 8.6% |
| Albanians | 96.3 /100 | #117 | Exceptional 8.6% |
| Pueblo | 96.2 /100 | #118 | Exceptional 8.6% |
Demographics Similar to Immigrants from South Central Asia by Unemployment Among Women with Children Ages 6 to 17 years
In terms of unemployment among women with children ages 6 to 17 years, the demographic groups most similar to Immigrants from South Central Asia are Burmese (8.0%, a difference of 0.080%), Native Hawaiian (7.9%, a difference of 0.11%), Asian (8.0%, a difference of 0.11%), Immigrants from Korea (7.9%, a difference of 0.39%), and Immigrants from Cambodia (7.9%, a difference of 0.44%).
| Demographics | Rating | Rank | Unemployment Among Women with Children Ages 6 to 17 years |
| Immigrants | Uzbekistan | 100.0 /100 | #28 | Exceptional 7.8% |
| Thais | 100.0 /100 | #29 | Exceptional 7.8% |
| Immigrants | Iran | 100.0 /100 | #30 | Exceptional 7.9% |
| Laotians | 100.0 /100 | #31 | Exceptional 7.9% |
| Immigrants | Cambodia | 100.0 /100 | #32 | Exceptional 7.9% |
| Immigrants | Korea | 100.0 /100 | #33 | Exceptional 7.9% |
| Native Hawaiians | 100.0 /100 | #34 | Exceptional 7.9% |
| Immigrants | South Central Asia | 100.0 /100 | #35 | Exceptional 7.9% |
| Burmese | 100.0 /100 | #36 | Exceptional 8.0% |
| Asians | 100.0 /100 | #37 | Exceptional 8.0% |
| Alsatians | 100.0 /100 | #38 | Exceptional 8.0% |
| Somalis | 100.0 /100 | #39 | Exceptional 8.0% |
| Immigrants | Zimbabwe | 100.0 /100 | #40 | Exceptional 8.0% |
| Iranians | 100.0 /100 | #41 | Exceptional 8.0% |
| Immigrants | Somalia | 100.0 /100 | #42 | Exceptional 8.0% |