Immigrants from Somalia vs Kiowa Unemployment Among Ages 65 to 74 years
COMPARE
Immigrants from Somalia
Kiowa
Unemployment Among Ages 65 to 74 years
Unemployment Among Ages 65 to 74 years Comparison
Immigrants from Somalia
Kiowa
5.7%
UNEMPLOYMENT AMONG AGES 65 TO 74 YEARS
0.0/ 100
METRIC RATING
289th/ 347
METRIC RANK
5.1%
UNEMPLOYMENT AMONG AGES 65 TO 74 YEARS
99.3/ 100
METRIC RATING
63rd/ 347
METRIC RANK
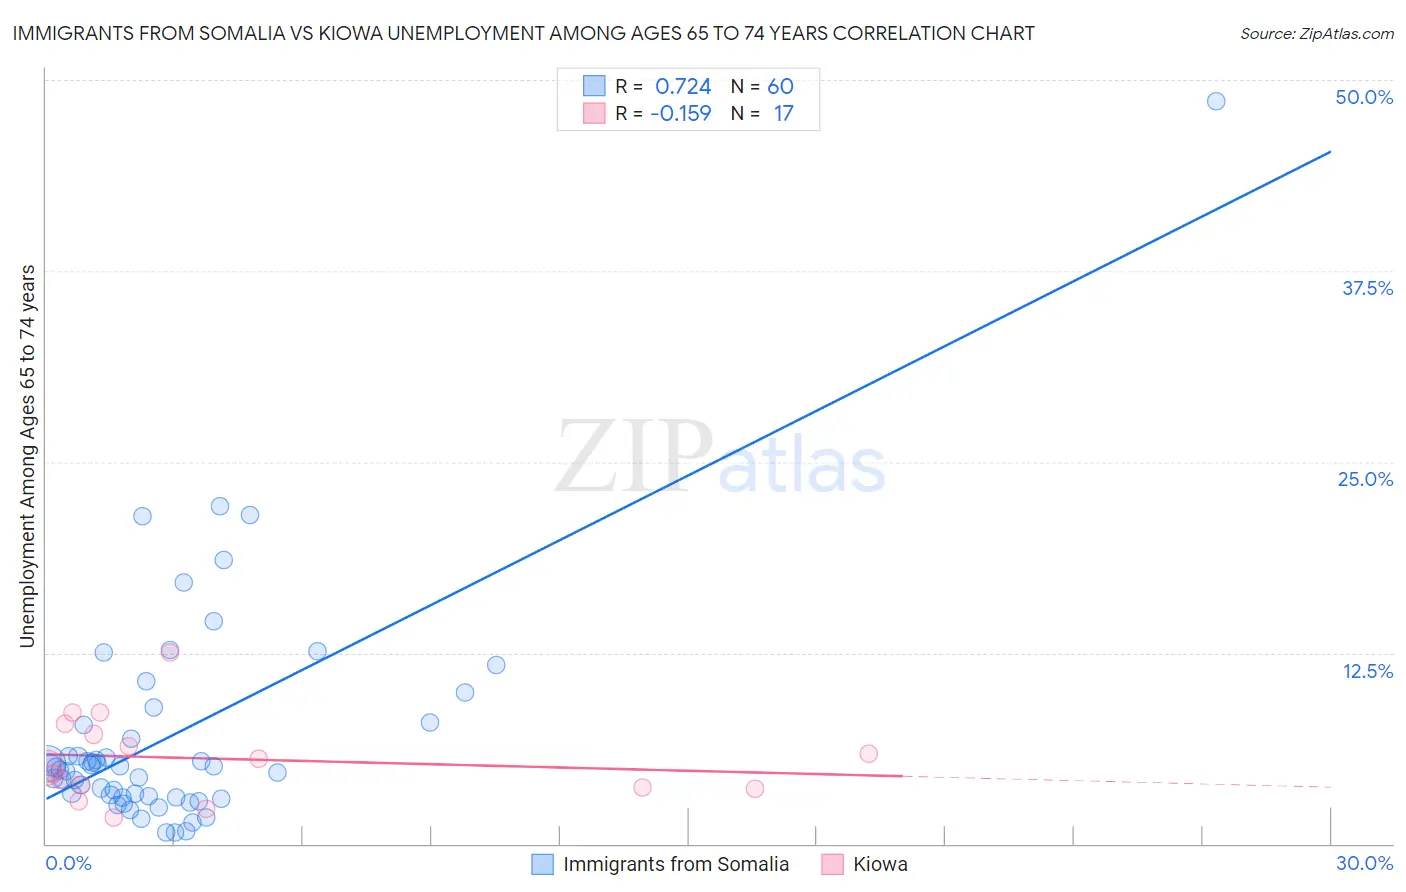
Immigrants from Somalia vs Kiowa Unemployment Among Ages 65 to 74 years Correlation Chart
The statistical analysis conducted on geographies consisting of 87,651,794 people shows a strong positive correlation between the proportion of Immigrants from Somalia and unemployment rate among population between the ages 65 and 74 in the United States with a correlation coefficient (R) of 0.724 and weighted average of 5.7%. Similarly, the statistical analysis conducted on geographies consisting of 53,606,186 people shows a poor negative correlation between the proportion of Kiowa and unemployment rate among population between the ages 65 and 74 in the United States with a correlation coefficient (R) of -0.159 and weighted average of 5.1%, a difference of 11.5%.
Unemployment Among Ages 65 to 74 years Correlation Summary
| Measurement | Immigrants from Somalia | Kiowa |
| Minimum | 0.70% | 1.7% |
| Maximum | 48.6% | 12.5% |
| Range | 47.9% | 10.8% |
| Mean | 7.1% | 5.6% |
| Median | 5.0% | 5.0% |
| Interquartile 25% (IQ1) | 3.1% | 3.6% |
| Interquartile 75% (IQ3) | 7.8% | 7.5% |
| Interquartile Range (IQR) | 4.8% | 3.9% |
| Standard Deviation (Sample) | 7.5% | 2.8% |
| Standard Deviation (Population) | 7.5% | 2.7% |
Similar Demographics by Unemployment Among Ages 65 to 74 years
Demographics Similar to Immigrants from Somalia by Unemployment Among Ages 65 to 74 years
In terms of unemployment among ages 65 to 74 years, the demographic groups most similar to Immigrants from Somalia are Central American (5.7%, a difference of 0.0%), Spanish American Indian (5.7%, a difference of 0.26%), Portuguese (5.7%, a difference of 0.29%), Central American Indian (5.7%, a difference of 0.44%), and U.S. Virgin Islander (5.8%, a difference of 0.51%).
| Demographics | Rating | Rank | Unemployment Among Ages 65 to 74 years |
| Ottawa | 0.1 /100 | #282 | Tragic 5.7% |
| Cypriots | 0.1 /100 | #283 | Tragic 5.7% |
| Chippewa | 0.1 /100 | #284 | Tragic 5.7% |
| Immigrants | Sierra Leone | 0.1 /100 | #285 | Tragic 5.7% |
| Marshallese | 0.1 /100 | #286 | Tragic 5.7% |
| Central American Indians | 0.0 /100 | #287 | Tragic 5.7% |
| Central Americans | 0.0 /100 | #288 | Tragic 5.7% |
| Immigrants | Somalia | 0.0 /100 | #289 | Tragic 5.7% |
| Spanish American Indians | 0.0 /100 | #290 | Tragic 5.7% |
| Portuguese | 0.0 /100 | #291 | Tragic 5.7% |
| U.S. Virgin Islanders | 0.0 /100 | #292 | Tragic 5.8% |
| Immigrants | Grenada | 0.0 /100 | #293 | Tragic 5.8% |
| Immigrants | Morocco | 0.0 /100 | #294 | Tragic 5.8% |
| Blacks/African Americans | 0.0 /100 | #295 | Tragic 5.8% |
| Pennsylvania Germans | 0.0 /100 | #296 | Tragic 5.8% |
Demographics Similar to Kiowa by Unemployment Among Ages 65 to 74 years
In terms of unemployment among ages 65 to 74 years, the demographic groups most similar to Kiowa are Nicaraguan (5.1%, a difference of 0.040%), Immigrants from Taiwan (5.1%, a difference of 0.050%), Immigrants from Moldova (5.1%, a difference of 0.050%), Bolivian (5.1%, a difference of 0.060%), and Iroquois (5.1%, a difference of 0.090%).
| Demographics | Rating | Rank | Unemployment Among Ages 65 to 74 years |
| Swedes | 99.5 /100 | #56 | Exceptional 5.1% |
| Croatians | 99.5 /100 | #57 | Exceptional 5.1% |
| Germans | 99.5 /100 | #58 | Exceptional 5.1% |
| Immigrants | Bulgaria | 99.4 /100 | #59 | Exceptional 5.1% |
| Immigrants | Jordan | 99.4 /100 | #60 | Exceptional 5.1% |
| Immigrants | Taiwan | 99.4 /100 | #61 | Exceptional 5.1% |
| Nicaraguans | 99.4 /100 | #62 | Exceptional 5.1% |
| Kiowa | 99.3 /100 | #63 | Exceptional 5.1% |
| Immigrants | Moldova | 99.3 /100 | #64 | Exceptional 5.1% |
| Bolivians | 99.3 /100 | #65 | Exceptional 5.1% |
| Iroquois | 99.3 /100 | #66 | Exceptional 5.1% |
| Swiss | 99.2 /100 | #67 | Exceptional 5.1% |
| Latvians | 99.2 /100 | #68 | Exceptional 5.1% |
| Scandinavians | 99.1 /100 | #69 | Exceptional 5.2% |
| Immigrants | Japan | 99.1 /100 | #70 | Exceptional 5.2% |