Immigrants from Taiwan vs Black/African American Male Unemployment
COMPARE
Immigrants from Taiwan
Black/African American
Male Unemployment
Male Unemployment Comparison
Immigrants from Taiwan
Blacks/African Americans
4.8%
MALE UNEMPLOYMENT
99.9/ 100
METRIC RATING
21st/ 347
METRIC RANK
6.9%
MALE UNEMPLOYMENT
0.0/ 100
METRIC RATING
310th/ 347
METRIC RANK
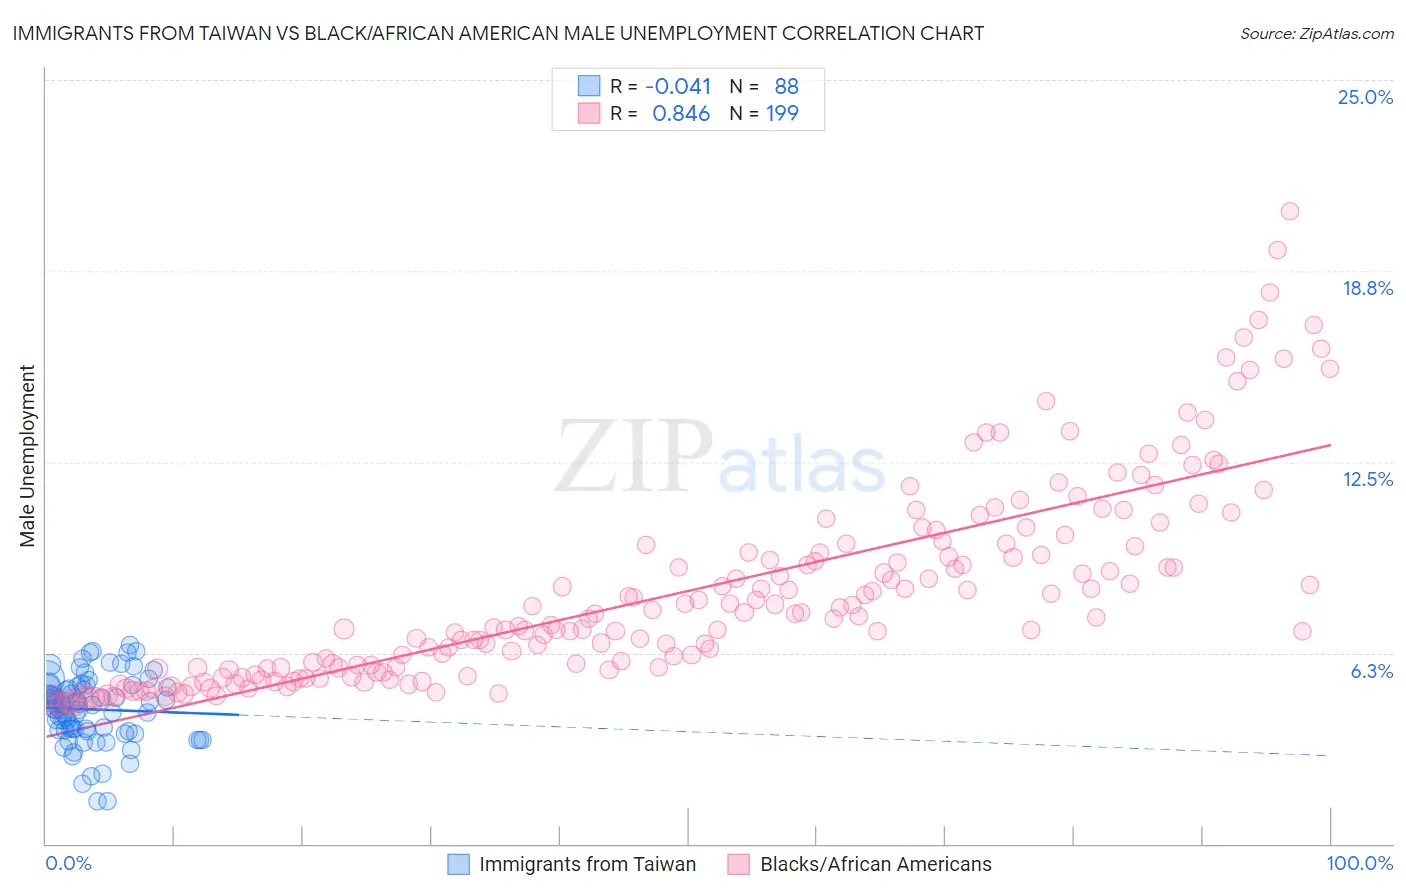
Immigrants from Taiwan vs Black/African American Male Unemployment Correlation Chart
The statistical analysis conducted on geographies consisting of 297,680,447 people shows no correlation between the proportion of Immigrants from Taiwan and unemployment rate among males in the United States with a correlation coefficient (R) of -0.041 and weighted average of 4.8%. Similarly, the statistical analysis conducted on geographies consisting of 557,031,145 people shows a very strong positive correlation between the proportion of Blacks/African Americans and unemployment rate among males in the United States with a correlation coefficient (R) of 0.846 and weighted average of 6.9%, a difference of 44.7%.
Male Unemployment Correlation Summary
| Measurement | Immigrants from Taiwan | Black/African American |
| Minimum | 1.4% | 4.5% |
| Maximum | 6.5% | 20.7% |
| Range | 5.1% | 16.2% |
| Mean | 4.4% | 8.3% |
| Median | 4.5% | 7.4% |
| Interquartile 25% (IQ1) | 3.7% | 5.7% |
| Interquartile 75% (IQ3) | 5.1% | 9.7% |
| Interquartile Range (IQR) | 1.4% | 4.0% |
| Standard Deviation (Sample) | 1.1% | 3.3% |
| Standard Deviation (Population) | 1.1% | 3.2% |
Similar Demographics by Male Unemployment
Demographics Similar to Immigrants from Taiwan by Male Unemployment
In terms of male unemployment, the demographic groups most similar to Immigrants from Taiwan are Carpatho Rusyn (4.8%, a difference of 0.010%), Tongan (4.8%, a difference of 0.060%), Immigrants from South Central Asia (4.8%, a difference of 0.090%), Pennsylvania German (4.8%, a difference of 0.16%), and Zimbabwean (4.8%, a difference of 0.19%).
| Demographics | Rating | Rank | Male Unemployment |
| Germans | 100.0 /100 | #14 | Exceptional 4.7% |
| Scandinavians | 100.0 /100 | #15 | Exceptional 4.7% |
| Swiss | 99.9 /100 | #16 | Exceptional 4.7% |
| Filipinos | 99.9 /100 | #17 | Exceptional 4.7% |
| English | 99.9 /100 | #18 | Exceptional 4.8% |
| Europeans | 99.9 /100 | #19 | Exceptional 4.8% |
| Pennsylvania Germans | 99.9 /100 | #20 | Exceptional 4.8% |
| Immigrants | Taiwan | 99.9 /100 | #21 | Exceptional 4.8% |
| Carpatho Rusyns | 99.9 /100 | #22 | Exceptional 4.8% |
| Tongans | 99.9 /100 | #23 | Exceptional 4.8% |
| Immigrants | South Central Asia | 99.9 /100 | #24 | Exceptional 4.8% |
| Zimbabweans | 99.9 /100 | #25 | Exceptional 4.8% |
| Dutch | 99.9 /100 | #26 | Exceptional 4.8% |
| Belgians | 99.9 /100 | #27 | Exceptional 4.8% |
| Bulgarians | 99.8 /100 | #28 | Exceptional 4.8% |
Demographics Similar to Blacks/African Americans by Male Unemployment
In terms of male unemployment, the demographic groups most similar to Blacks/African Americans are Immigrants from Armenia (6.9%, a difference of 0.31%), Lumbee (6.9%, a difference of 0.52%), Barbadian (6.9%, a difference of 0.64%), Aleut (6.8%, a difference of 1.1%), and Immigrants from Dominica (7.0%, a difference of 1.6%).
| Demographics | Rating | Rank | Male Unemployment |
| Immigrants | West Indies | 0.0 /100 | #303 | Tragic 6.7% |
| West Indians | 0.0 /100 | #304 | Tragic 6.7% |
| Trinidadians and Tobagonians | 0.0 /100 | #305 | Tragic 6.7% |
| Immigrants | Trinidad and Tobago | 0.0 /100 | #306 | Tragic 6.7% |
| Immigrants | Jamaica | 0.0 /100 | #307 | Tragic 6.7% |
| Aleuts | 0.0 /100 | #308 | Tragic 6.8% |
| Barbadians | 0.0 /100 | #309 | Tragic 6.9% |
| Blacks/African Americans | 0.0 /100 | #310 | Tragic 6.9% |
| Immigrants | Armenia | 0.0 /100 | #311 | Tragic 6.9% |
| Lumbee | 0.0 /100 | #312 | Tragic 6.9% |
| Immigrants | Dominica | 0.0 /100 | #313 | Tragic 7.0% |
| Immigrants | Barbados | 0.0 /100 | #314 | Tragic 7.1% |
| Houma | 0.0 /100 | #315 | Tragic 7.1% |
| Immigrants | Guyana | 0.0 /100 | #316 | Tragic 7.1% |
| Guyanese | 0.0 /100 | #317 | Tragic 7.1% |