Immigrants from Syria vs Senegalese 2nd Grade
COMPARE
Immigrants from Syria
Senegalese
2nd Grade
2nd Grade Comparison
Immigrants from Syria
Senegalese
97.6%
2ND GRADE
4.0/ 100
METRIC RATING
226th/ 347
METRIC RANK
97.6%
2ND GRADE
3.1/ 100
METRIC RATING
230th/ 347
METRIC RANK
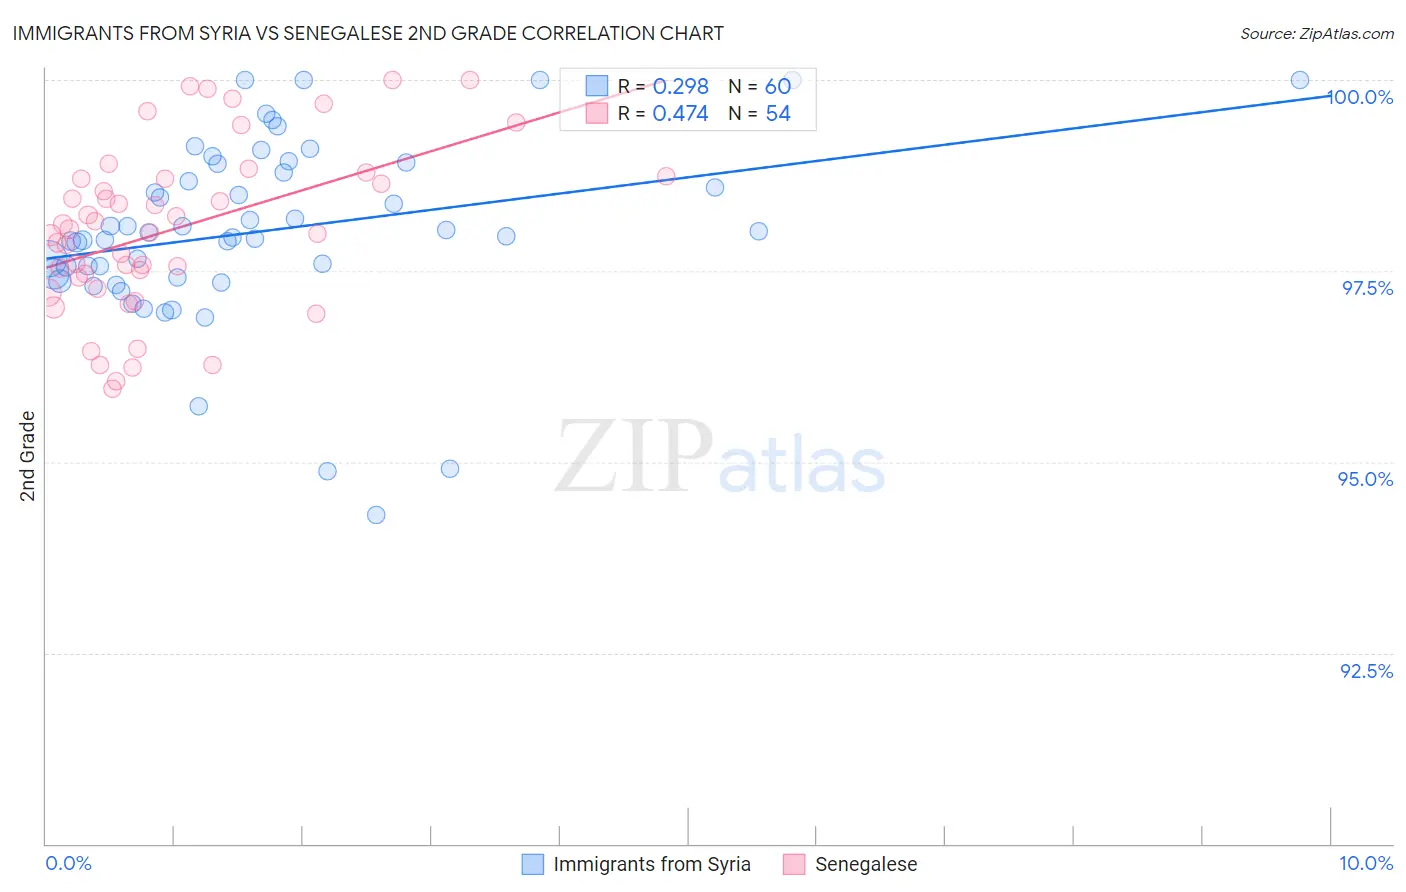
Immigrants from Syria vs Senegalese 2nd Grade Correlation Chart
The statistical analysis conducted on geographies consisting of 174,108,374 people shows a weak positive correlation between the proportion of Immigrants from Syria and percentage of population with at least 2nd grade education in the United States with a correlation coefficient (R) of 0.298 and weighted average of 97.6%. Similarly, the statistical analysis conducted on geographies consisting of 78,142,569 people shows a moderate positive correlation between the proportion of Senegalese and percentage of population with at least 2nd grade education in the United States with a correlation coefficient (R) of 0.474 and weighted average of 97.6%, a difference of 0.020%.
2nd Grade Correlation Summary
| Measurement | Immigrants from Syria | Senegalese |
| Minimum | 94.3% | 96.0% |
| Maximum | 100.0% | 100.0% |
| Range | 5.7% | 4.0% |
| Mean | 98.0% | 98.0% |
| Median | 98.0% | 98.0% |
| Interquartile 25% (IQ1) | 97.4% | 97.4% |
| Interquartile 75% (IQ3) | 98.8% | 98.7% |
| Interquartile Range (IQR) | 1.4% | 1.3% |
| Standard Deviation (Sample) | 1.2% | 1.1% |
| Standard Deviation (Population) | 1.2% | 1.1% |
Demographics Similar to Immigrants from Syria and Senegalese by 2nd Grade
In terms of 2nd grade, the demographic groups most similar to Immigrants from Syria are Immigrants from Nepal (97.6%, a difference of 0.0%), Iraqi (97.6%, a difference of 0.010%), Immigrants from Sudan (97.6%, a difference of 0.010%), Sierra Leonean (97.6%, a difference of 0.010%), and Immigrants from Zaire (97.6%, a difference of 0.010%). Similarly, the demographic groups most similar to Senegalese are Immigrants from Costa Rica (97.6%, a difference of 0.0%), Subsaharan African (97.6%, a difference of 0.010%), Immigrants from Nepal (97.6%, a difference of 0.020%), Immigrants from Pakistan (97.6%, a difference of 0.020%), and Iraqi (97.6%, a difference of 0.030%).
| Demographics | Rating | Rank | 2nd Grade |
| Sudanese | 5.7 /100 | #218 | Tragic 97.7% |
| Immigrants | Panama | 5.1 /100 | #219 | Tragic 97.6% |
| Immigrants | Morocco | 5.0 /100 | #220 | Tragic 97.6% |
| Iraqis | 4.6 /100 | #221 | Tragic 97.6% |
| Immigrants | Sudan | 4.5 /100 | #222 | Tragic 97.6% |
| Sierra Leoneans | 4.3 /100 | #223 | Tragic 97.6% |
| Immigrants | Zaire | 4.3 /100 | #224 | Tragic 97.6% |
| Tongans | 4.3 /100 | #225 | Tragic 97.6% |
| Immigrants | Syria | 4.0 /100 | #226 | Tragic 97.6% |
| Immigrants | Nepal | 4.0 /100 | #227 | Tragic 97.6% |
| Sub-Saharan Africans | 3.4 /100 | #228 | Tragic 97.6% |
| Immigrants | Costa Rica | 3.1 /100 | #229 | Tragic 97.6% |
| Senegalese | 3.1 /100 | #230 | Tragic 97.6% |
| Immigrants | Pakistan | 2.3 /100 | #231 | Tragic 97.6% |
| Immigrants | Western Asia | 2.1 /100 | #232 | Tragic 97.6% |
| Immigrants | Uruguay | 2.1 /100 | #233 | Tragic 97.6% |
| Immigrants | Malaysia | 2.0 /100 | #234 | Tragic 97.6% |
| Colombians | 1.9 /100 | #235 | Tragic 97.6% |
| Nigerians | 1.7 /100 | #236 | Tragic 97.6% |
| U.S. Virgin Islanders | 1.6 /100 | #237 | Tragic 97.6% |
| Immigrants | Eastern Asia | 1.6 /100 | #238 | Tragic 97.6% |