Immigrants from Syria vs Osage Female Unemployment
COMPARE
Immigrants from Syria
Osage
Female Unemployment
Female Unemployment Comparison
Immigrants from Syria
Osage
5.6%
FEMALE UNEMPLOYMENT
0.8/ 100
METRIC RATING
250th/ 347
METRIC RANK
4.9%
FEMALE UNEMPLOYMENT
98.2/ 100
METRIC RATING
70th/ 347
METRIC RANK
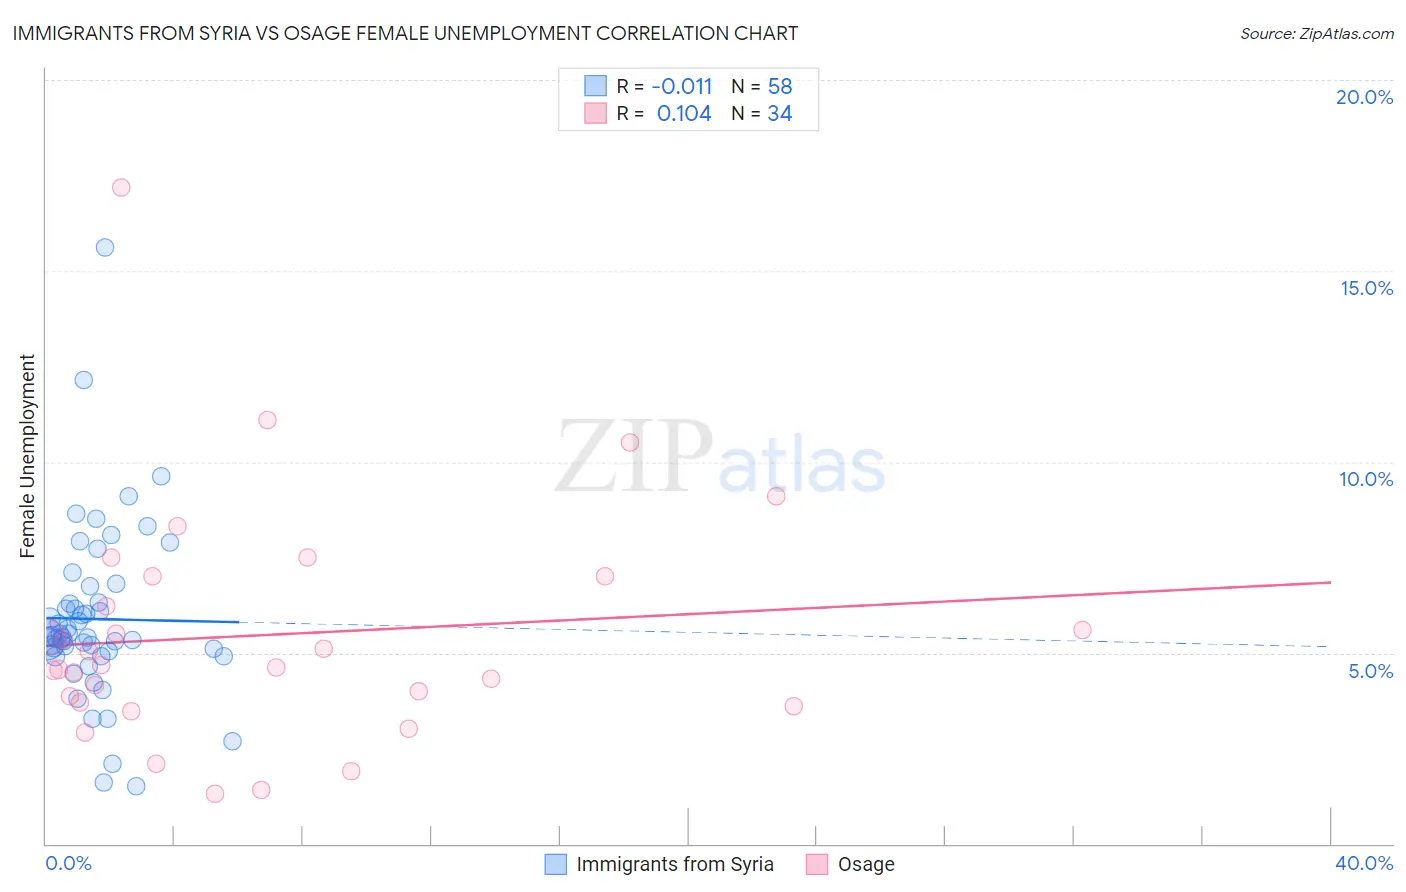
Immigrants from Syria vs Osage Female Unemployment Correlation Chart
The statistical analysis conducted on geographies consisting of 173,953,717 people shows no correlation between the proportion of Immigrants from Syria and unemploymnet rate among females in the United States with a correlation coefficient (R) of -0.011 and weighted average of 5.6%. Similarly, the statistical analysis conducted on geographies consisting of 91,544,897 people shows a poor positive correlation between the proportion of Osage and unemploymnet rate among females in the United States with a correlation coefficient (R) of 0.104 and weighted average of 4.9%, a difference of 14.1%.
Female Unemployment Correlation Summary
| Measurement | Immigrants from Syria | Osage |
| Minimum | 1.5% | 1.3% |
| Maximum | 15.6% | 17.2% |
| Range | 14.1% | 15.9% |
| Mean | 5.9% | 5.5% |
| Median | 5.4% | 4.6% |
| Interquartile 25% (IQ1) | 5.0% | 3.7% |
| Interquartile 75% (IQ3) | 6.3% | 7.0% |
| Interquartile Range (IQR) | 1.3% | 3.3% |
| Standard Deviation (Sample) | 2.3% | 3.1% |
| Standard Deviation (Population) | 2.3% | 3.1% |
Similar Demographics by Female Unemployment
Demographics Similar to Immigrants from Syria by Female Unemployment
In terms of female unemployment, the demographic groups most similar to Immigrants from Syria are Assyrian/Chaldean/Syriac (5.6%, a difference of 0.060%), Cajun (5.7%, a difference of 0.26%), Immigrants from Uzbekistan (5.6%, a difference of 0.29%), Cree (5.6%, a difference of 0.33%), and Immigrants from Sierra Leone (5.7%, a difference of 0.41%).
| Demographics | Rating | Rank | Female Unemployment |
| Spanish Americans | 2.2 /100 | #243 | Tragic 5.6% |
| Immigrants | Liberia | 1.5 /100 | #244 | Tragic 5.6% |
| Guamanians/Chamorros | 1.4 /100 | #245 | Tragic 5.6% |
| Japanese | 1.2 /100 | #246 | Tragic 5.6% |
| Immigrants | Western Asia | 1.1 /100 | #247 | Tragic 5.6% |
| Cree | 1.0 /100 | #248 | Tragic 5.6% |
| Immigrants | Uzbekistan | 1.0 /100 | #249 | Tragic 5.6% |
| Immigrants | Syria | 0.8 /100 | #250 | Tragic 5.6% |
| Assyrians/Chaldeans/Syriacs | 0.8 /100 | #251 | Tragic 5.6% |
| Cajuns | 0.7 /100 | #252 | Tragic 5.7% |
| Immigrants | Sierra Leone | 0.6 /100 | #253 | Tragic 5.7% |
| Immigrants | Immigrants | 0.6 /100 | #254 | Tragic 5.7% |
| Immigrants | Cameroon | 0.6 /100 | #255 | Tragic 5.7% |
| Sub-Saharan Africans | 0.4 /100 | #256 | Tragic 5.7% |
| Dutch West Indians | 0.3 /100 | #257 | Tragic 5.7% |
Demographics Similar to Osage by Female Unemployment
In terms of female unemployment, the demographic groups most similar to Osage are Immigrants from Ireland (4.9%, a difference of 0.040%), Tlingit-Haida (4.9%, a difference of 0.050%), Hungarian (4.9%, a difference of 0.060%), Cuban (4.9%, a difference of 0.060%), and German Russian (4.9%, a difference of 0.080%).
| Demographics | Rating | Rank | Female Unemployment |
| Immigrants | Belgium | 98.5 /100 | #63 | Exceptional 4.9% |
| Celtics | 98.5 /100 | #64 | Exceptional 4.9% |
| Immigrants | North America | 98.3 /100 | #65 | Exceptional 4.9% |
| Hungarians | 98.3 /100 | #66 | Exceptional 4.9% |
| Cubans | 98.3 /100 | #67 | Exceptional 4.9% |
| Tlingit-Haida | 98.3 /100 | #68 | Exceptional 4.9% |
| Immigrants | Ireland | 98.2 /100 | #69 | Exceptional 4.9% |
| Osage | 98.2 /100 | #70 | Exceptional 4.9% |
| German Russians | 98.1 /100 | #71 | Exceptional 4.9% |
| Immigrants | Northern Europe | 98.0 /100 | #72 | Exceptional 4.9% |
| Russians | 98.0 /100 | #73 | Exceptional 5.0% |
| Immigrants | Bolivia | 98.0 /100 | #74 | Exceptional 5.0% |
| Immigrants | Singapore | 98.0 /100 | #75 | Exceptional 5.0% |
| Immigrants | Venezuela | 97.9 /100 | #76 | Exceptional 5.0% |
| Mongolians | 97.8 /100 | #77 | Exceptional 5.0% |