Immigrants from Sudan vs Immigrants from Northern Europe Unemployment Among Women with Children Under 6 years
COMPARE
Immigrants from Sudan
Immigrants from Northern Europe
Unemployment Among Women with Children Under 6 years
Unemployment Among Women with Children Under 6 years Comparison
Immigrants from Sudan
Immigrants from Northern Europe
8.0%
UNEMPLOYMENT AMONG WOMEN WITH CHILDREN UNDER 6 YEARS
6.0/ 100
METRIC RATING
228th/ 347
METRIC RANK
7.2%
UNEMPLOYMENT AMONG WOMEN WITH CHILDREN UNDER 6 YEARS
97.4/ 100
METRIC RATING
100th/ 347
METRIC RANK
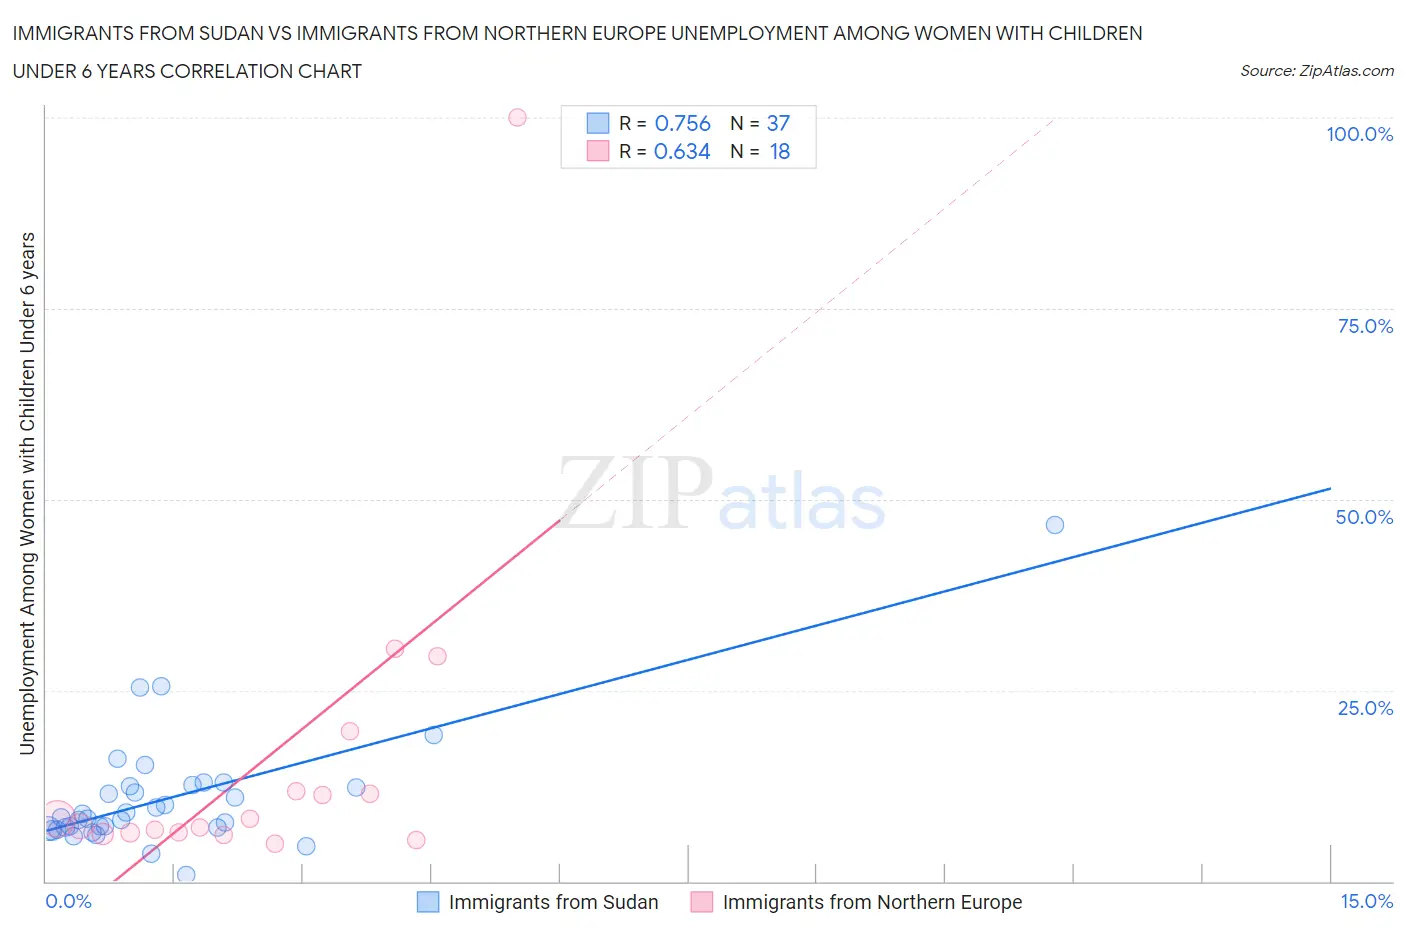
Immigrants from Sudan vs Immigrants from Northern Europe Unemployment Among Women with Children Under 6 years Correlation Chart
The statistical analysis conducted on geographies consisting of 108,811,214 people shows a strong positive correlation between the proportion of Immigrants from Sudan and unemployment rate among women with children under the age of 6 in the United States with a correlation coefficient (R) of 0.756 and weighted average of 8.0%. Similarly, the statistical analysis conducted on geographies consisting of 342,036,687 people shows a significant positive correlation between the proportion of Immigrants from Northern Europe and unemployment rate among women with children under the age of 6 in the United States with a correlation coefficient (R) of 0.634 and weighted average of 7.2%, a difference of 11.2%.
Unemployment Among Women with Children Under 6 years Correlation Summary
| Measurement | Immigrants from Sudan | Immigrants from Northern Europe |
| Minimum | 0.90% | 4.9% |
| Maximum | 46.7% | 100.0% |
| Range | 45.8% | 95.1% |
| Mean | 11.0% | 15.9% |
| Median | 8.4% | 7.7% |
| Interquartile 25% (IQ1) | 7.0% | 6.4% |
| Interquartile 75% (IQ3) | 12.5% | 11.8% |
| Interquartile Range (IQR) | 5.5% | 5.4% |
| Standard Deviation (Sample) | 7.9% | 22.4% |
| Standard Deviation (Population) | 7.8% | 21.7% |
Similar Demographics by Unemployment Among Women with Children Under 6 years
Demographics Similar to Immigrants from Sudan by Unemployment Among Women with Children Under 6 years
In terms of unemployment among women with children under 6 years, the demographic groups most similar to Immigrants from Sudan are Portuguese (8.0%, a difference of 0.030%), Senegalese (8.0%, a difference of 0.040%), Salvadoran (8.0%, a difference of 0.15%), Finnish (8.0%, a difference of 0.22%), and Trinidadian and Tobagonian (8.0%, a difference of 0.22%).
| Demographics | Rating | Rank | Unemployment Among Women with Children Under 6 years |
| Immigrants | Germany | 8.5 /100 | #221 | Tragic 7.9% |
| Samoans | 8.4 /100 | #222 | Tragic 7.9% |
| Carpatho Rusyns | 7.8 /100 | #223 | Tragic 8.0% |
| English | 7.2 /100 | #224 | Tragic 8.0% |
| Germans | 7.0 /100 | #225 | Tragic 8.0% |
| Senegalese | 6.2 /100 | #226 | Tragic 8.0% |
| Portuguese | 6.2 /100 | #227 | Tragic 8.0% |
| Immigrants | Sudan | 6.0 /100 | #228 | Tragic 8.0% |
| Salvadorans | 5.5 /100 | #229 | Tragic 8.0% |
| Finns | 5.3 /100 | #230 | Tragic 8.0% |
| Trinidadians and Tobagonians | 5.3 /100 | #231 | Tragic 8.0% |
| Welsh | 5.0 /100 | #232 | Tragic 8.0% |
| Immigrants | Trinidad and Tobago | 4.8 /100 | #233 | Tragic 8.0% |
| Kiowa | 4.4 /100 | #234 | Tragic 8.0% |
| Comanche | 4.3 /100 | #235 | Tragic 8.0% |
Demographics Similar to Immigrants from Northern Europe by Unemployment Among Women with Children Under 6 years
In terms of unemployment among women with children under 6 years, the demographic groups most similar to Immigrants from Northern Europe are Chilean (7.2%, a difference of 0.020%), Immigrants from Europe (7.2%, a difference of 0.040%), Immigrants from Nicaragua (7.2%, a difference of 0.050%), Immigrants from Saudi Arabia (7.2%, a difference of 0.050%), and Russian (7.2%, a difference of 0.080%).
| Demographics | Rating | Rank | Unemployment Among Women with Children Under 6 years |
| New Zealanders | 97.8 /100 | #93 | Exceptional 7.2% |
| Macedonians | 97.7 /100 | #94 | Exceptional 7.2% |
| Romanians | 97.7 /100 | #95 | Exceptional 7.2% |
| Immigrants | Eastern Africa | 97.7 /100 | #96 | Exceptional 7.2% |
| Immigrants | South Eastern Asia | 97.6 /100 | #97 | Exceptional 7.2% |
| Russians | 97.5 /100 | #98 | Exceptional 7.2% |
| Immigrants | Europe | 97.5 /100 | #99 | Exceptional 7.2% |
| Immigrants | Northern Europe | 97.4 /100 | #100 | Exceptional 7.2% |
| Chileans | 97.4 /100 | #101 | Exceptional 7.2% |
| Immigrants | Nicaragua | 97.3 /100 | #102 | Exceptional 7.2% |
| Immigrants | Saudi Arabia | 97.3 /100 | #103 | Exceptional 7.2% |
| Immigrants | Egypt | 97.2 /100 | #104 | Exceptional 7.2% |
| Venezuelans | 97.2 /100 | #105 | Exceptional 7.2% |
| Immigrants | Pakistan | 97.2 /100 | #106 | Exceptional 7.2% |
| Immigrants | Kazakhstan | 97.1 /100 | #107 | Exceptional 7.2% |