Immigrants from Switzerland vs Slovene Unemployment Among Women with Children Ages 6 to 17 years
COMPARE
Immigrants from Switzerland
Slovene
Unemployment Among Women with Children Ages 6 to 17 years
Unemployment Among Women with Children Ages 6 to 17 years Comparison
Immigrants from Switzerland
Slovenes
8.1%
UNEMPLOYMENT AMONG WOMEN WITH CHILDREN AGES 6 TO 17 YEARS
100.0/ 100
METRIC RATING
47th/ 347
METRIC RANK
9.1%
UNEMPLOYMENT AMONG WOMEN WITH CHILDREN AGES 6 TO 17 YEARS
28.5/ 100
METRIC RATING
190th/ 347
METRIC RANK
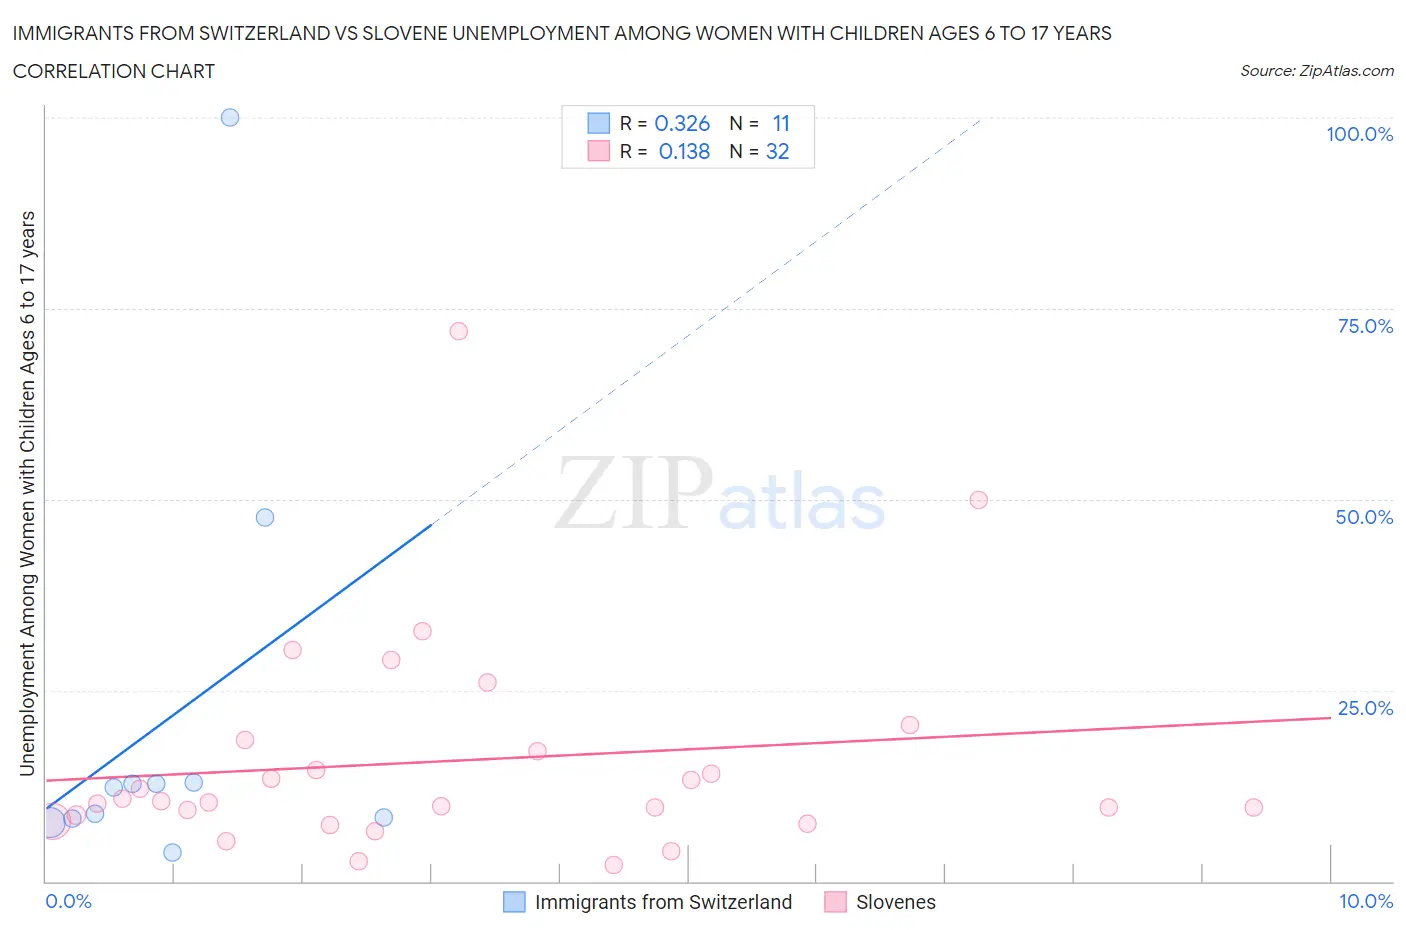
Immigrants from Switzerland vs Slovene Unemployment Among Women with Children Ages 6 to 17 years Correlation Chart
The statistical analysis conducted on geographies consisting of 119,509,037 people shows a mild positive correlation between the proportion of Immigrants from Switzerland and unemployment rate among women with children between the ages 6 and 17 in the United States with a correlation coefficient (R) of 0.326 and weighted average of 8.1%. Similarly, the statistical analysis conducted on geographies consisting of 193,849,840 people shows a poor positive correlation between the proportion of Slovenes and unemployment rate among women with children between the ages 6 and 17 in the United States with a correlation coefficient (R) of 0.138 and weighted average of 9.1%, a difference of 12.2%.
Unemployment Among Women with Children Ages 6 to 17 years Correlation Summary
| Measurement | Immigrants from Switzerland | Slovene |
| Minimum | 3.8% | 2.1% |
| Maximum | 100.0% | 71.9% |
| Range | 96.2% | 69.8% |
| Mean | 21.4% | 15.8% |
| Median | 12.3% | 10.4% |
| Interquartile 25% (IQ1) | 8.2% | 8.3% |
| Interquartile 75% (IQ3) | 12.9% | 17.8% |
| Interquartile Range (IQR) | 4.7% | 9.5% |
| Standard Deviation (Sample) | 28.6% | 14.4% |
| Standard Deviation (Population) | 27.3% | 14.2% |
Similar Demographics by Unemployment Among Women with Children Ages 6 to 17 years
Demographics Similar to Immigrants from Switzerland by Unemployment Among Women with Children Ages 6 to 17 years
In terms of unemployment among women with children ages 6 to 17 years, the demographic groups most similar to Immigrants from Switzerland are Icelander (8.1%, a difference of 0.040%), Immigrants from Bulgaria (8.1%, a difference of 0.060%), Immigrants from Sweden (8.1%, a difference of 0.10%), Immigrants from Asia (8.1%, a difference of 0.13%), and Bhutanese (8.1%, a difference of 0.14%).
| Demographics | Rating | Rank | Unemployment Among Women with Children Ages 6 to 17 years |
| Immigrants | Zimbabwe | 100.0 /100 | #40 | Exceptional 8.0% |
| Iranians | 100.0 /100 | #41 | Exceptional 8.0% |
| Immigrants | Somalia | 100.0 /100 | #42 | Exceptional 8.0% |
| Bhutanese | 100.0 /100 | #43 | Exceptional 8.1% |
| Immigrants | Sweden | 100.0 /100 | #44 | Exceptional 8.1% |
| Immigrants | Bulgaria | 100.0 /100 | #45 | Exceptional 8.1% |
| Icelanders | 100.0 /100 | #46 | Exceptional 8.1% |
| Immigrants | Switzerland | 100.0 /100 | #47 | Exceptional 8.1% |
| Immigrants | Asia | 100.0 /100 | #48 | Exceptional 8.1% |
| Immigrants | Oceania | 100.0 /100 | #49 | Exceptional 8.1% |
| Hawaiians | 100.0 /100 | #50 | Exceptional 8.1% |
| Immigrants | Sudan | 100.0 /100 | #51 | Exceptional 8.1% |
| Immigrants | Iraq | 100.0 /100 | #52 | Exceptional 8.1% |
| Danes | 100.0 /100 | #53 | Exceptional 8.1% |
| Immigrants | Armenia | 100.0 /100 | #54 | Exceptional 8.2% |
Demographics Similar to Slovenes by Unemployment Among Women with Children Ages 6 to 17 years
In terms of unemployment among women with children ages 6 to 17 years, the demographic groups most similar to Slovenes are Belizean (9.1%, a difference of 0.0%), Immigrants (9.1%, a difference of 0.040%), Immigrants from Syria (9.1%, a difference of 0.070%), Guamanian/Chamorro (9.1%, a difference of 0.070%), and Comanche (9.0%, a difference of 0.080%).
| Demographics | Rating | Rank | Unemployment Among Women with Children Ages 6 to 17 years |
| Swiss | 33.5 /100 | #183 | Fair 9.0% |
| Palestinians | 33.4 /100 | #184 | Fair 9.0% |
| Immigrants | Congo | 32.5 /100 | #185 | Fair 9.0% |
| Immigrants | Spain | 32.4 /100 | #186 | Fair 9.0% |
| Comanche | 30.0 /100 | #187 | Fair 9.0% |
| Immigrants | Syria | 29.7 /100 | #188 | Fair 9.1% |
| Immigrants | Immigrants | 29.2 /100 | #189 | Fair 9.1% |
| Slovenes | 28.5 /100 | #190 | Fair 9.1% |
| Belizeans | 28.4 /100 | #191 | Fair 9.1% |
| Guamanians/Chamorros | 27.2 /100 | #192 | Fair 9.1% |
| Immigrants | Turkey | 25.8 /100 | #193 | Fair 9.1% |
| Immigrants | Kazakhstan | 25.3 /100 | #194 | Fair 9.1% |
| Austrians | 25.0 /100 | #195 | Fair 9.1% |
| Brazilians | 24.4 /100 | #196 | Fair 9.1% |
| Immigrants | Panama | 24.3 /100 | #197 | Fair 9.1% |