Immigrants from Switzerland vs Immigrants from Zaire Unemployment Among Women with Children Ages 6 to 17 years
COMPARE
Immigrants from Switzerland
Immigrants from Zaire
Unemployment Among Women with Children Ages 6 to 17 years
Unemployment Among Women with Children Ages 6 to 17 years Comparison
Immigrants from Switzerland
Immigrants from Zaire
8.1%
UNEMPLOYMENT AMONG WOMEN WITH CHILDREN AGES 6 TO 17 YEARS
100.0/ 100
METRIC RATING
47th/ 347
METRIC RANK
9.0%
UNEMPLOYMENT AMONG WOMEN WITH CHILDREN AGES 6 TO 17 YEARS
38.3/ 100
METRIC RATING
179th/ 347
METRIC RANK
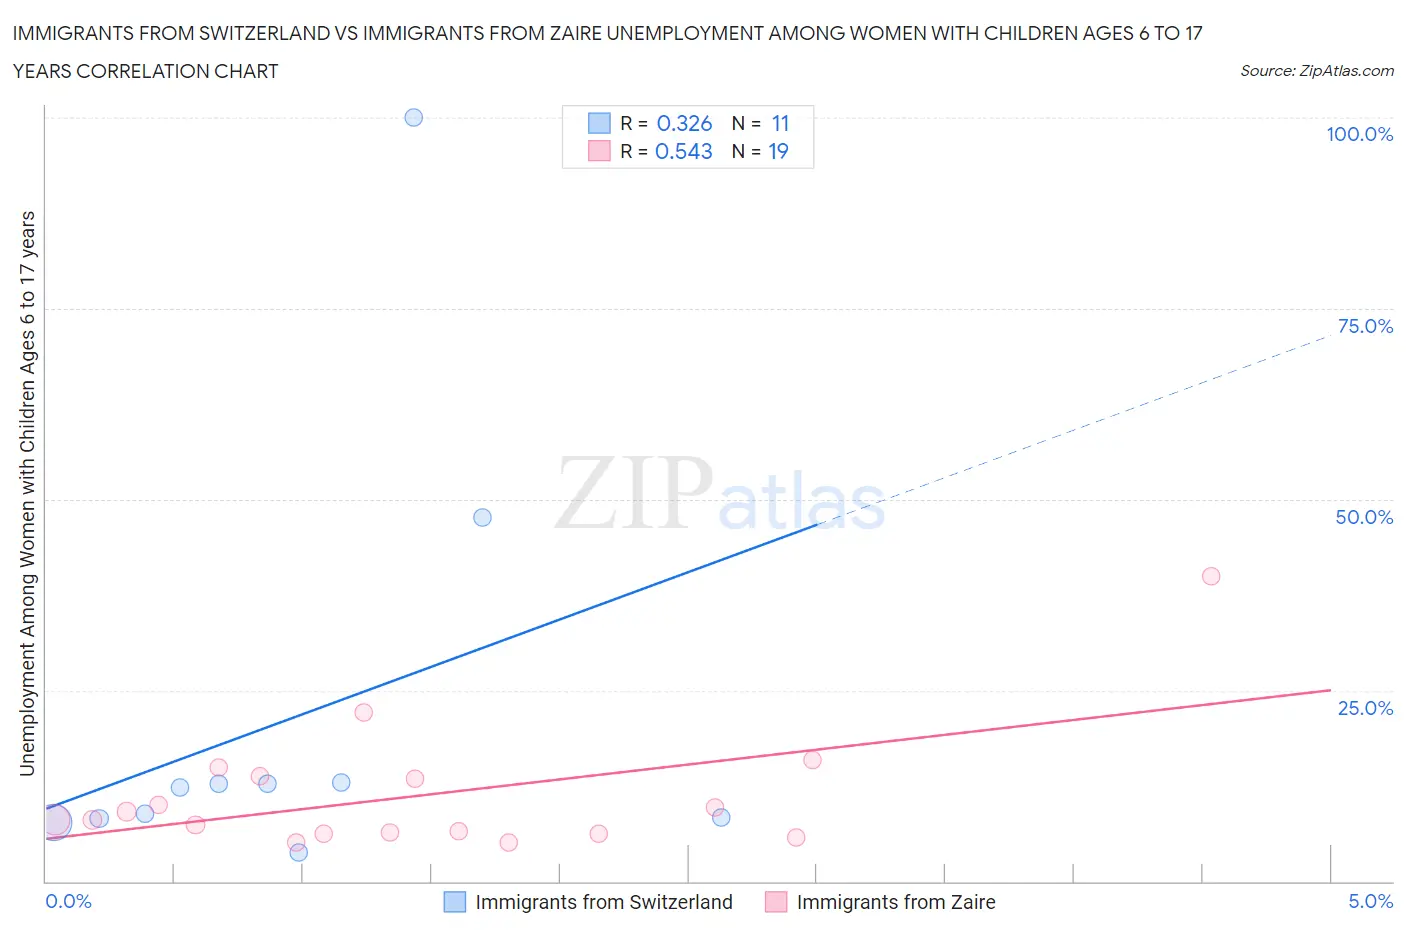
Immigrants from Switzerland vs Immigrants from Zaire Unemployment Among Women with Children Ages 6 to 17 years Correlation Chart
The statistical analysis conducted on geographies consisting of 119,509,037 people shows a mild positive correlation between the proportion of Immigrants from Switzerland and unemployment rate among women with children between the ages 6 and 17 in the United States with a correlation coefficient (R) of 0.326 and weighted average of 8.1%. Similarly, the statistical analysis conducted on geographies consisting of 94,396,135 people shows a substantial positive correlation between the proportion of Immigrants from Zaire and unemployment rate among women with children between the ages 6 and 17 in the United States with a correlation coefficient (R) of 0.543 and weighted average of 9.0%, a difference of 11.7%.
Unemployment Among Women with Children Ages 6 to 17 years Correlation Summary
| Measurement | Immigrants from Switzerland | Immigrants from Zaire |
| Minimum | 3.8% | 5.1% |
| Maximum | 100.0% | 40.0% |
| Range | 96.2% | 34.9% |
| Mean | 21.4% | 11.2% |
| Median | 12.3% | 8.0% |
| Interquartile 25% (IQ1) | 8.2% | 6.3% |
| Interquartile 75% (IQ3) | 12.9% | 13.7% |
| Interquartile Range (IQR) | 4.7% | 7.4% |
| Standard Deviation (Sample) | 28.6% | 8.3% |
| Standard Deviation (Population) | 27.3% | 8.1% |
Similar Demographics by Unemployment Among Women with Children Ages 6 to 17 years
Demographics Similar to Immigrants from Switzerland by Unemployment Among Women with Children Ages 6 to 17 years
In terms of unemployment among women with children ages 6 to 17 years, the demographic groups most similar to Immigrants from Switzerland are Icelander (8.1%, a difference of 0.040%), Immigrants from Bulgaria (8.1%, a difference of 0.060%), Immigrants from Sweden (8.1%, a difference of 0.10%), Immigrants from Asia (8.1%, a difference of 0.13%), and Bhutanese (8.1%, a difference of 0.14%).
| Demographics | Rating | Rank | Unemployment Among Women with Children Ages 6 to 17 years |
| Immigrants | Zimbabwe | 100.0 /100 | #40 | Exceptional 8.0% |
| Iranians | 100.0 /100 | #41 | Exceptional 8.0% |
| Immigrants | Somalia | 100.0 /100 | #42 | Exceptional 8.0% |
| Bhutanese | 100.0 /100 | #43 | Exceptional 8.1% |
| Immigrants | Sweden | 100.0 /100 | #44 | Exceptional 8.1% |
| Immigrants | Bulgaria | 100.0 /100 | #45 | Exceptional 8.1% |
| Icelanders | 100.0 /100 | #46 | Exceptional 8.1% |
| Immigrants | Switzerland | 100.0 /100 | #47 | Exceptional 8.1% |
| Immigrants | Asia | 100.0 /100 | #48 | Exceptional 8.1% |
| Immigrants | Oceania | 100.0 /100 | #49 | Exceptional 8.1% |
| Hawaiians | 100.0 /100 | #50 | Exceptional 8.1% |
| Immigrants | Sudan | 100.0 /100 | #51 | Exceptional 8.1% |
| Immigrants | Iraq | 100.0 /100 | #52 | Exceptional 8.1% |
| Danes | 100.0 /100 | #53 | Exceptional 8.1% |
| Immigrants | Armenia | 100.0 /100 | #54 | Exceptional 8.2% |
Demographics Similar to Immigrants from Zaire by Unemployment Among Women with Children Ages 6 to 17 years
In terms of unemployment among women with children ages 6 to 17 years, the demographic groups most similar to Immigrants from Zaire are Ethiopian (9.0%, a difference of 0.030%), Menominee (9.0%, a difference of 0.040%), Immigrants from Jordan (9.0%, a difference of 0.15%), Immigrants from Czechoslovakia (9.0%, a difference of 0.18%), and South American Indian (9.0%, a difference of 0.19%).
| Demographics | Rating | Rank | Unemployment Among Women with Children Ages 6 to 17 years |
| Immigrants | West Indies | 52.2 /100 | #172 | Average 9.0% |
| Immigrants | Brazil | 51.0 /100 | #173 | Average 9.0% |
| Immigrants | Costa Rica | 50.0 /100 | #174 | Average 9.0% |
| Immigrants | Sierra Leone | 45.9 /100 | #175 | Average 9.0% |
| Immigrants | Italy | 43.7 /100 | #176 | Average 9.0% |
| Immigrants | Jordan | 41.6 /100 | #177 | Average 9.0% |
| Menominee | 39.3 /100 | #178 | Fair 9.0% |
| Immigrants | Zaire | 38.3 /100 | #179 | Fair 9.0% |
| Ethiopians | 37.6 /100 | #180 | Fair 9.0% |
| Immigrants | Czechoslovakia | 34.5 /100 | #181 | Fair 9.0% |
| South American Indians | 34.4 /100 | #182 | Fair 9.0% |
| Swiss | 33.5 /100 | #183 | Fair 9.0% |
| Palestinians | 33.4 /100 | #184 | Fair 9.0% |
| Immigrants | Congo | 32.5 /100 | #185 | Fair 9.0% |
| Immigrants | Spain | 32.4 /100 | #186 | Fair 9.0% |