Slovak vs French Canadian Unemployment Among Ages 25 to 29 years
COMPARE
Slovak
French Canadian
Unemployment Among Ages 25 to 29 years
Unemployment Among Ages 25 to 29 years Comparison
Slovaks
French Canadians
6.8%
UNEMPLOYMENT AMONG AGES 25 TO 29 YEARS
14.3/ 100
METRIC RATING
216th/ 347
METRIC RANK
7.0%
UNEMPLOYMENT AMONG AGES 25 TO 29 YEARS
2.4/ 100
METRIC RATING
234th/ 347
METRIC RANK
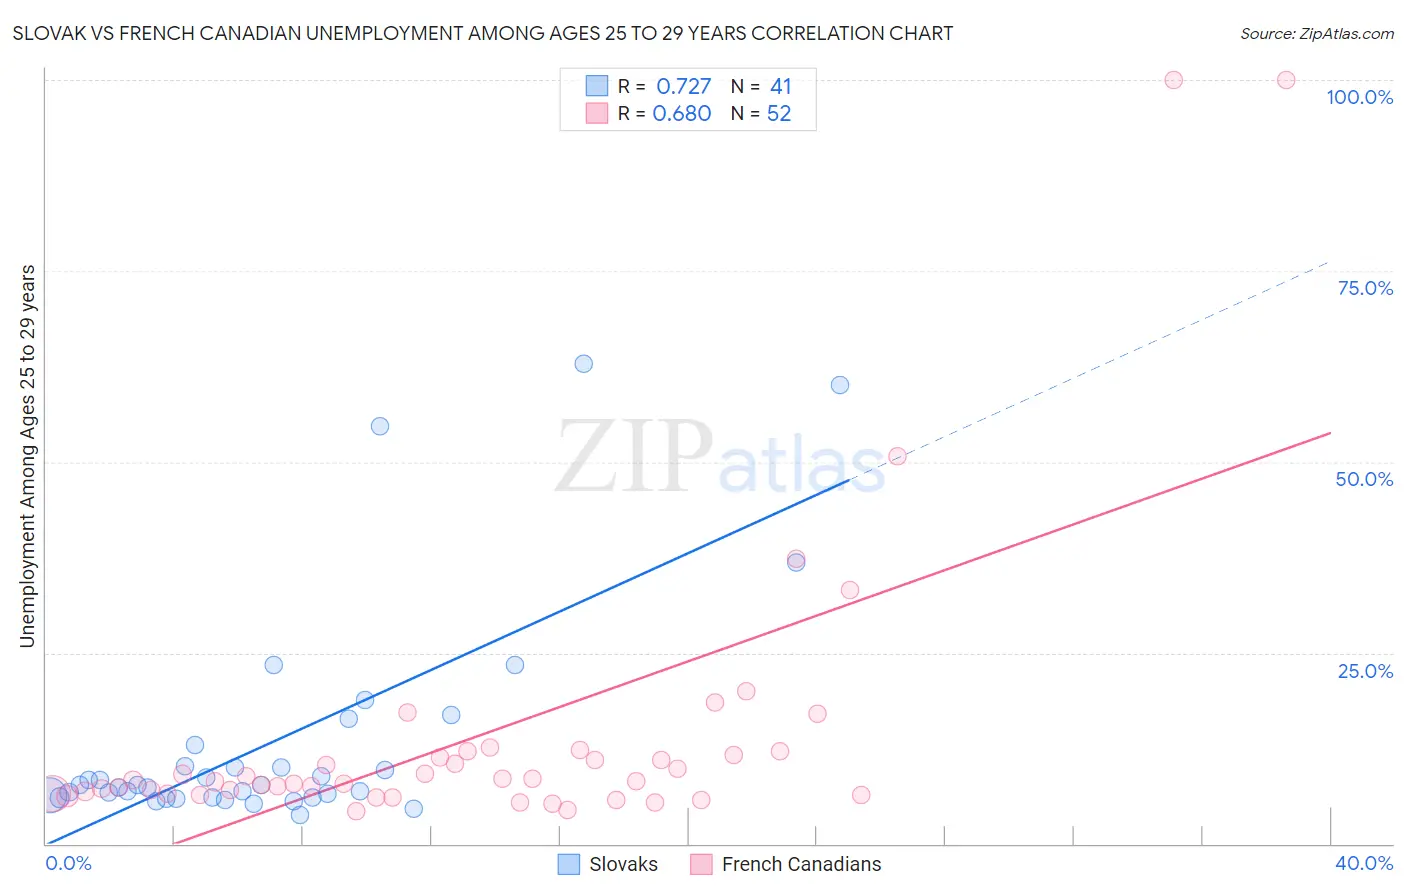
Slovak vs French Canadian Unemployment Among Ages 25 to 29 years Correlation Chart
The statistical analysis conducted on geographies consisting of 372,100,083 people shows a strong positive correlation between the proportion of Slovaks and unemployment rate among population between the ages 25 and 29 in the United States with a correlation coefficient (R) of 0.727 and weighted average of 6.8%. Similarly, the statistical analysis conducted on geographies consisting of 459,076,360 people shows a significant positive correlation between the proportion of French Canadians and unemployment rate among population between the ages 25 and 29 in the United States with a correlation coefficient (R) of 0.680 and weighted average of 7.0%, a difference of 2.9%.
Unemployment Among Ages 25 to 29 years Correlation Summary
| Measurement | Slovak | French Canadian |
| Minimum | 3.8% | 4.3% |
| Maximum | 62.9% | 100.0% |
| Range | 59.1% | 95.7% |
| Mean | 13.3% | 14.3% |
| Median | 7.7% | 8.3% |
| Interquartile 25% (IQ1) | 6.0% | 6.6% |
| Interquartile 75% (IQ3) | 11.5% | 11.9% |
| Interquartile Range (IQR) | 5.5% | 5.3% |
| Standard Deviation (Sample) | 14.5% | 19.2% |
| Standard Deviation (Population) | 14.3% | 19.0% |
Demographics Similar to Slovaks and French Canadians by Unemployment Among Ages 25 to 29 years
In terms of unemployment among ages 25 to 29 years, the demographic groups most similar to Slovaks are Spanish (6.8%, a difference of 0.020%), Ute (6.8%, a difference of 0.11%), Immigrants from Austria (6.8%, a difference of 0.25%), White/Caucasian (6.9%, a difference of 0.51%), and French (6.9%, a difference of 0.52%). Similarly, the demographic groups most similar to French Canadians are Immigrants from Honduras (7.0%, a difference of 0.020%), Panamanian (7.0%, a difference of 0.16%), Spanish American (7.0%, a difference of 0.21%), Central American (7.0%, a difference of 0.36%), and Immigrants from El Salvador (7.0%, a difference of 0.65%).
| Demographics | Rating | Rank | Unemployment Among Ages 25 to 29 years |
| Spanish | 14.4 /100 | #215 | Poor 6.8% |
| Slovaks | 14.3 /100 | #216 | Poor 6.8% |
| Ute | 13.4 /100 | #217 | Poor 6.8% |
| Immigrants | Austria | 12.3 /100 | #218 | Poor 6.8% |
| Whites/Caucasians | 10.6 /100 | #219 | Poor 6.9% |
| French | 10.5 /100 | #220 | Poor 6.9% |
| Israelis | 9.8 /100 | #221 | Tragic 6.9% |
| Spaniards | 7.7 /100 | #222 | Tragic 6.9% |
| Celtics | 7.6 /100 | #223 | Tragic 6.9% |
| Immigrants | Immigrants | 6.2 /100 | #224 | Tragic 6.9% |
| Japanese | 5.4 /100 | #225 | Tragic 6.9% |
| Immigrants | Liberia | 4.8 /100 | #226 | Tragic 7.0% |
| Salvadorans | 4.4 /100 | #227 | Tragic 7.0% |
| Immigrants | Panama | 4.2 /100 | #228 | Tragic 7.0% |
| Bermudans | 3.8 /100 | #229 | Tragic 7.0% |
| Immigrants | El Salvador | 3.6 /100 | #230 | Tragic 7.0% |
| Central Americans | 3.0 /100 | #231 | Tragic 7.0% |
| Spanish Americans | 2.7 /100 | #232 | Tragic 7.0% |
| Immigrants | Honduras | 2.4 /100 | #233 | Tragic 7.0% |
| French Canadians | 2.4 /100 | #234 | Tragic 7.0% |
| Panamanians | 2.1 /100 | #235 | Tragic 7.0% |