Immigrants from Sudan vs Immigrants from Jordan Unemployment Among Youth under 25 years
COMPARE
Immigrants from Sudan
Immigrants from Jordan
Unemployment Among Youth under 25 years
Unemployment Among Youth under 25 years Comparison
Immigrants from Sudan
Immigrants from Jordan
10.5%
UNEMPLOYMENT AMONG YOUTH UNDER 25 YEARS
100.0/ 100
METRIC RATING
12th/ 347
METRIC RANK
11.3%
UNEMPLOYMENT AMONG YOUTH UNDER 25 YEARS
93.1/ 100
METRIC RATING
105th/ 347
METRIC RANK
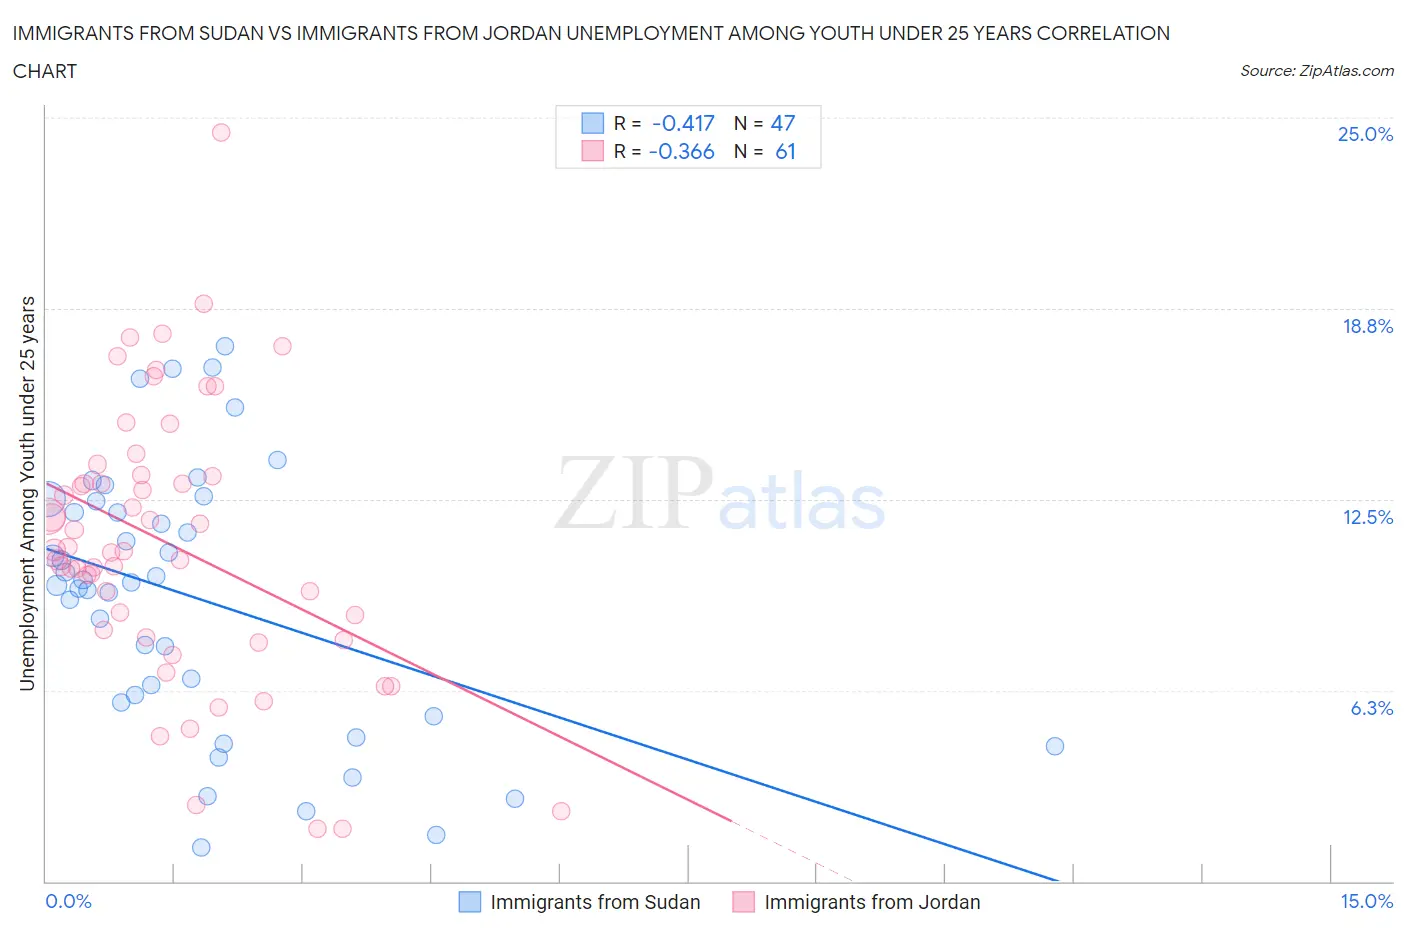
Immigrants from Sudan vs Immigrants from Jordan Unemployment Among Youth under 25 years Correlation Chart
The statistical analysis conducted on geographies consisting of 118,803,399 people shows a moderate negative correlation between the proportion of Immigrants from Sudan and unemployment rate among youth under the age of 25 in the United States with a correlation coefficient (R) of -0.417 and weighted average of 10.5%. Similarly, the statistical analysis conducted on geographies consisting of 180,849,460 people shows a mild negative correlation between the proportion of Immigrants from Jordan and unemployment rate among youth under the age of 25 in the United States with a correlation coefficient (R) of -0.366 and weighted average of 11.3%, a difference of 7.1%.
Unemployment Among Youth under 25 years Correlation Summary
| Measurement | Immigrants from Sudan | Immigrants from Jordan |
| Minimum | 1.1% | 1.7% |
| Maximum | 17.5% | 24.5% |
| Range | 16.4% | 22.8% |
| Mean | 9.3% | 11.0% |
| Median | 9.8% | 10.8% |
| Interquartile 25% (IQ1) | 5.8% | 8.1% |
| Interquartile 75% (IQ3) | 12.4% | 13.3% |
| Interquartile Range (IQR) | 6.6% | 5.1% |
| Standard Deviation (Sample) | 4.3% | 4.5% |
| Standard Deviation (Population) | 4.3% | 4.4% |
Similar Demographics by Unemployment Among Youth under 25 years
Demographics Similar to Immigrants from Sudan by Unemployment Among Youth under 25 years
In terms of unemployment among youth under 25 years, the demographic groups most similar to Immigrants from Sudan are Indonesian (10.6%, a difference of 0.12%), Cuban (10.6%, a difference of 0.14%), Scandinavian (10.5%, a difference of 0.18%), Sudanese (10.6%, a difference of 0.25%), and Venezuelan (10.6%, a difference of 0.26%).
| Demographics | Rating | Rank | Unemployment Among Youth under 25 years |
| Czechs | 100.0 /100 | #5 | Exceptional 10.3% |
| Danes | 100.0 /100 | #6 | Exceptional 10.3% |
| Swedes | 100.0 /100 | #7 | Exceptional 10.4% |
| Immigrants | Venezuela | 100.0 /100 | #8 | Exceptional 10.5% |
| Germans | 100.0 /100 | #9 | Exceptional 10.5% |
| Immigrants | Somalia | 100.0 /100 | #10 | Exceptional 10.5% |
| Scandinavians | 100.0 /100 | #11 | Exceptional 10.5% |
| Immigrants | Sudan | 100.0 /100 | #12 | Exceptional 10.5% |
| Indonesians | 100.0 /100 | #13 | Exceptional 10.6% |
| Cubans | 100.0 /100 | #14 | Exceptional 10.6% |
| Sudanese | 100.0 /100 | #15 | Exceptional 10.6% |
| Venezuelans | 100.0 /100 | #16 | Exceptional 10.6% |
| Menominee | 100.0 /100 | #17 | Exceptional 10.6% |
| Swiss | 100.0 /100 | #18 | Exceptional 10.6% |
| Immigrants | Burma/Myanmar | 100.0 /100 | #19 | Exceptional 10.6% |
Demographics Similar to Immigrants from Jordan by Unemployment Among Youth under 25 years
In terms of unemployment among youth under 25 years, the demographic groups most similar to Immigrants from Jordan are Chilean (11.3%, a difference of 0.010%), Immigrants from Lithuania (11.3%, a difference of 0.030%), Immigrants from Kuwait (11.3%, a difference of 0.040%), Immigrants from Afghanistan (11.3%, a difference of 0.060%), and Immigrants from Thailand (11.3%, a difference of 0.070%).
| Demographics | Rating | Rank | Unemployment Among Youth under 25 years |
| Estonians | 94.2 /100 | #98 | Exceptional 11.3% |
| Celtics | 94.0 /100 | #99 | Exceptional 11.3% |
| Pakistanis | 94.0 /100 | #100 | Exceptional 11.3% |
| Iroquois | 93.8 /100 | #101 | Exceptional 11.3% |
| Immigrants | Thailand | 93.6 /100 | #102 | Exceptional 11.3% |
| Immigrants | Malaysia | 93.6 /100 | #103 | Exceptional 11.3% |
| Immigrants | Afghanistan | 93.4 /100 | #104 | Exceptional 11.3% |
| Immigrants | Jordan | 93.1 /100 | #105 | Exceptional 11.3% |
| Chileans | 93.0 /100 | #106 | Exceptional 11.3% |
| Immigrants | Lithuania | 92.9 /100 | #107 | Exceptional 11.3% |
| Immigrants | Kuwait | 92.9 /100 | #108 | Exceptional 11.3% |
| Iranians | 92.0 /100 | #109 | Exceptional 11.3% |
| Immigrants | Norway | 91.5 /100 | #110 | Exceptional 11.3% |
| Immigrants | France | 90.3 /100 | #111 | Exceptional 11.3% |
| Immigrants | Austria | 90.3 /100 | #112 | Exceptional 11.3% |