Immigrants from St. Vincent and the Grenadines vs Immigrants from Ghana Unemployment Among Youth under 25 years
COMPARE
Immigrants from St. Vincent and the Grenadines
Immigrants from Ghana
Unemployment Among Youth under 25 years
Unemployment Among Youth under 25 years Comparison
Immigrants from St. Vincent and the Grenadines
Immigrants from Ghana
16.1%
UNEMPLOYMENT AMONG YOUTH UNDER 25 YEARS
0.0/ 100
METRIC RATING
335th/ 347
METRIC RANK
13.4%
UNEMPLOYMENT AMONG YOUTH UNDER 25 YEARS
0.0/ 100
METRIC RATING
289th/ 347
METRIC RANK
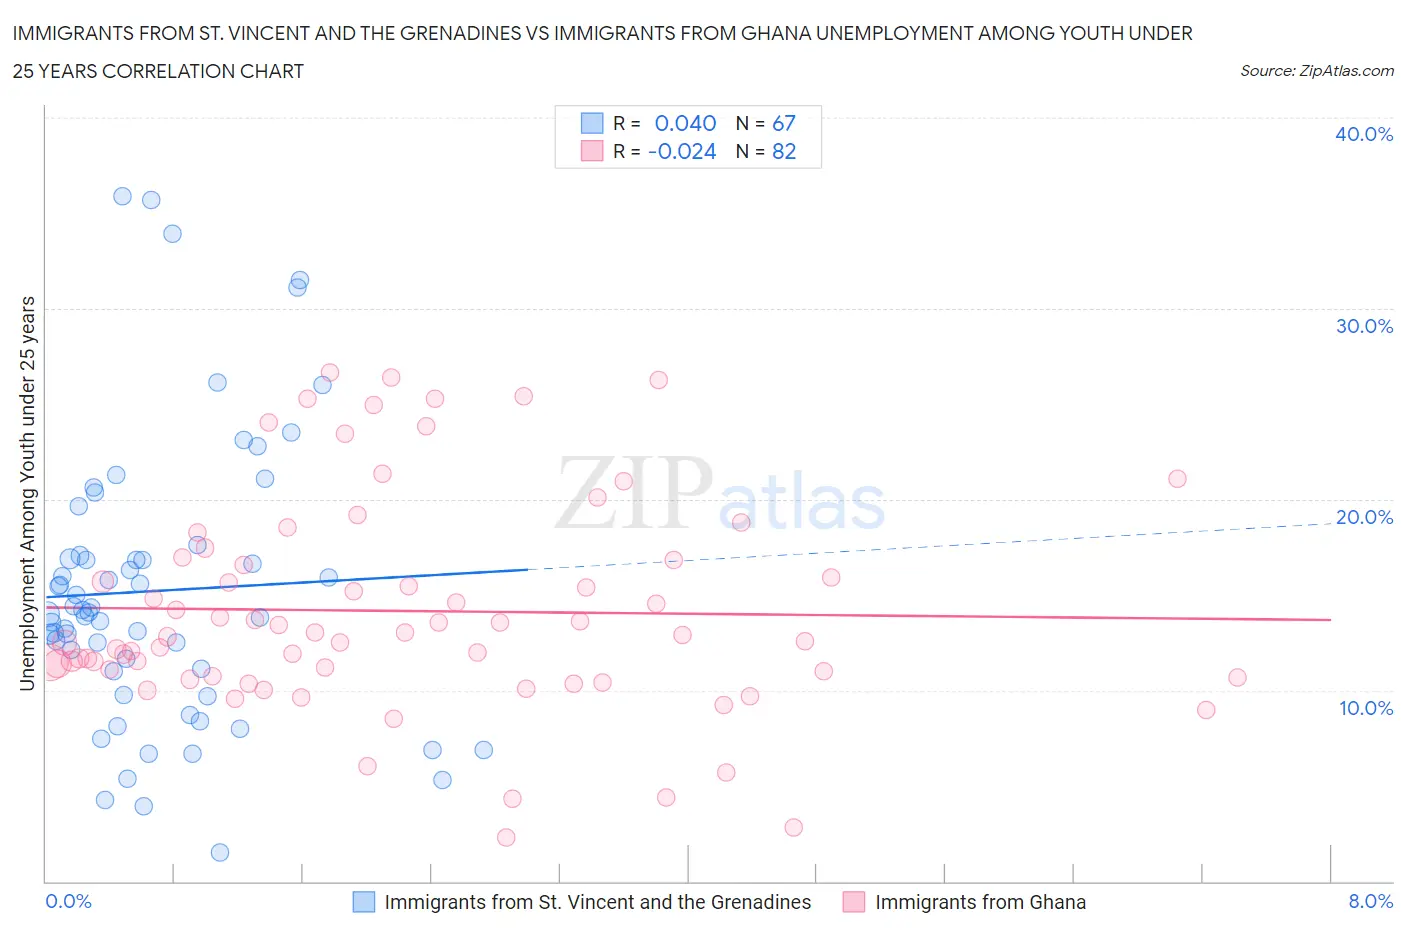
Immigrants from St. Vincent and the Grenadines vs Immigrants from Ghana Unemployment Among Youth under 25 years Correlation Chart
The statistical analysis conducted on geographies consisting of 56,125,672 people shows no correlation between the proportion of Immigrants from St. Vincent and the Grenadines and unemployment rate among youth under the age of 25 in the United States with a correlation coefficient (R) of 0.040 and weighted average of 16.1%. Similarly, the statistical analysis conducted on geographies consisting of 199,301,284 people shows no correlation between the proportion of Immigrants from Ghana and unemployment rate among youth under the age of 25 in the United States with a correlation coefficient (R) of -0.024 and weighted average of 13.4%, a difference of 20.7%.
Unemployment Among Youth under 25 years Correlation Summary
| Measurement | Immigrants from St. Vincent and the Grenadines | Immigrants from Ghana |
| Minimum | 1.5% | 2.3% |
| Maximum | 35.9% | 26.6% |
| Range | 34.4% | 24.3% |
| Mean | 15.2% | 14.2% |
| Median | 14.0% | 12.9% |
| Interquartile 25% (IQ1) | 11.0% | 10.7% |
| Interquartile 75% (IQ3) | 17.1% | 16.8% |
| Interquartile Range (IQR) | 6.0% | 6.1% |
| Standard Deviation (Sample) | 7.4% | 5.6% |
| Standard Deviation (Population) | 7.4% | 5.5% |
Similar Demographics by Unemployment Among Youth under 25 years
Demographics Similar to Immigrants from St. Vincent and the Grenadines by Unemployment Among Youth under 25 years
In terms of unemployment among youth under 25 years, the demographic groups most similar to Immigrants from St. Vincent and the Grenadines are Pima (16.2%, a difference of 0.64%), Arapaho (16.3%, a difference of 0.80%), Yuman (16.3%, a difference of 1.1%), Immigrants from Guyana (15.9%, a difference of 1.3%), and Guyanese (15.9%, a difference of 1.6%).
| Demographics | Rating | Rank | Unemployment Among Youth under 25 years |
| Immigrants | Dominican Republic | 0.0 /100 | #328 | Tragic 15.6% |
| Immigrants | Yemen | 0.0 /100 | #329 | Tragic 15.6% |
| Yakama | 0.0 /100 | #330 | Tragic 15.6% |
| Dominicans | 0.0 /100 | #331 | Tragic 15.7% |
| Immigrants | Grenada | 0.0 /100 | #332 | Tragic 15.8% |
| Guyanese | 0.0 /100 | #333 | Tragic 15.9% |
| Immigrants | Guyana | 0.0 /100 | #334 | Tragic 15.9% |
| Immigrants | St. Vincent and the Grenadines | 0.0 /100 | #335 | Tragic 16.1% |
| Pima | 0.0 /100 | #336 | Tragic 16.2% |
| Arapaho | 0.0 /100 | #337 | Tragic 16.3% |
| Yuman | 0.0 /100 | #338 | Tragic 16.3% |
| Tsimshian | 0.0 /100 | #339 | Tragic 16.5% |
| Colville | 0.0 /100 | #340 | Tragic 16.8% |
| Paiute | 0.0 /100 | #341 | Tragic 17.6% |
| Puerto Ricans | 0.0 /100 | #342 | Tragic 18.4% |
Demographics Similar to Immigrants from Ghana by Unemployment Among Youth under 25 years
In terms of unemployment among youth under 25 years, the demographic groups most similar to Immigrants from Ghana are Immigrants from Western Africa (13.4%, a difference of 0.11%), Immigrants from Ecuador (13.4%, a difference of 0.34%), Ecuadorian (13.3%, a difference of 0.54%), Blackfeet (13.3%, a difference of 0.55%), and Ghanaian (13.3%, a difference of 0.60%).
| Demographics | Rating | Rank | Unemployment Among Youth under 25 years |
| Sierra Leoneans | 0.0 /100 | #282 | Tragic 13.3% |
| Immigrants | Cameroon | 0.0 /100 | #283 | Tragic 13.3% |
| Lumbee | 0.0 /100 | #284 | Tragic 13.3% |
| Ghanaians | 0.0 /100 | #285 | Tragic 13.3% |
| Blackfeet | 0.0 /100 | #286 | Tragic 13.3% |
| Ecuadorians | 0.0 /100 | #287 | Tragic 13.3% |
| Immigrants | Western Africa | 0.0 /100 | #288 | Tragic 13.4% |
| Immigrants | Ghana | 0.0 /100 | #289 | Tragic 13.4% |
| Immigrants | Ecuador | 0.0 /100 | #290 | Tragic 13.4% |
| Apache | 0.0 /100 | #291 | Tragic 13.5% |
| Central American Indians | 0.0 /100 | #292 | Tragic 13.5% |
| Spanish American Indians | 0.0 /100 | #293 | Tragic 13.5% |
| Immigrants | Caribbean | 0.0 /100 | #294 | Tragic 13.5% |
| Chippewa | 0.0 /100 | #295 | Tragic 13.5% |
| Senegalese | 0.0 /100 | #296 | Tragic 13.5% |