Immigrants from St. Vincent and the Grenadines vs Immigrants from Bosnia and Herzegovina Unemployment Among Youth under 25 years
COMPARE
Immigrants from St. Vincent and the Grenadines
Immigrants from Bosnia and Herzegovina
Unemployment Among Youth under 25 years
Unemployment Among Youth under 25 years Comparison
Immigrants from St. Vincent and the Grenadines
Immigrants from Bosnia and Herzegovina
16.1%
UNEMPLOYMENT AMONG YOUTH UNDER 25 YEARS
0.0/ 100
METRIC RATING
335th/ 347
METRIC RANK
10.6%
UNEMPLOYMENT AMONG YOUTH UNDER 25 YEARS
100.0/ 100
METRIC RATING
23rd/ 347
METRIC RANK
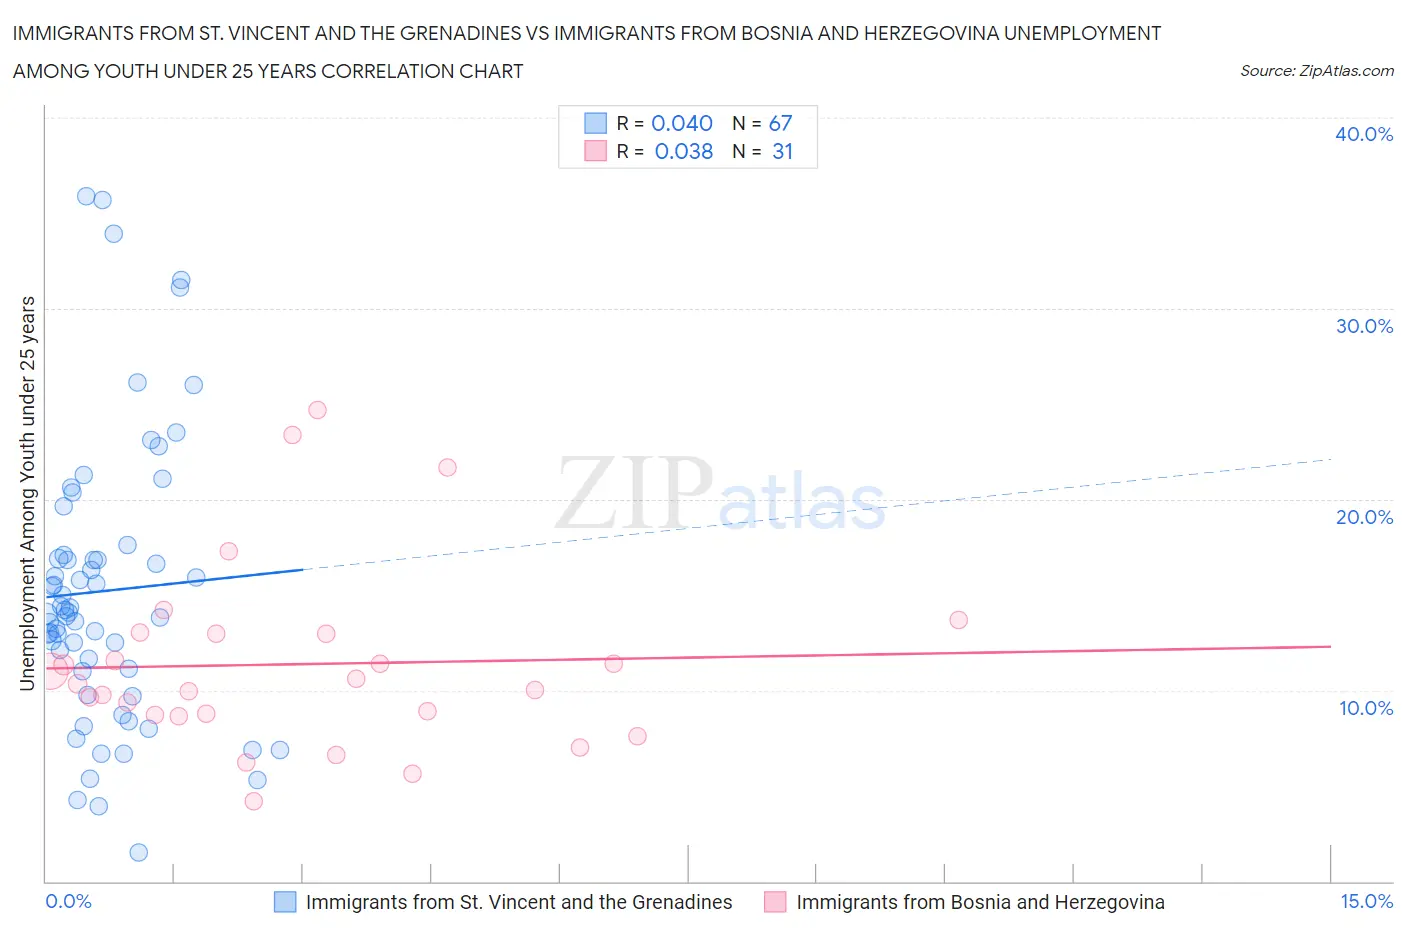
Immigrants from St. Vincent and the Grenadines vs Immigrants from Bosnia and Herzegovina Unemployment Among Youth under 25 years Correlation Chart
The statistical analysis conducted on geographies consisting of 56,125,672 people shows no correlation between the proportion of Immigrants from St. Vincent and the Grenadines and unemployment rate among youth under the age of 25 in the United States with a correlation coefficient (R) of 0.040 and weighted average of 16.1%. Similarly, the statistical analysis conducted on geographies consisting of 156,028,830 people shows no correlation between the proportion of Immigrants from Bosnia and Herzegovina and unemployment rate among youth under the age of 25 in the United States with a correlation coefficient (R) of 0.038 and weighted average of 10.6%, a difference of 51.8%.
Unemployment Among Youth under 25 years Correlation Summary
| Measurement | Immigrants from St. Vincent and the Grenadines | Immigrants from Bosnia and Herzegovina |
| Minimum | 1.5% | 4.2% |
| Maximum | 35.9% | 24.7% |
| Range | 34.4% | 20.5% |
| Mean | 15.2% | 11.4% |
| Median | 14.0% | 10.3% |
| Interquartile 25% (IQ1) | 11.0% | 8.7% |
| Interquartile 75% (IQ3) | 17.1% | 13.0% |
| Interquartile Range (IQR) | 6.0% | 4.3% |
| Standard Deviation (Sample) | 7.4% | 4.8% |
| Standard Deviation (Population) | 7.4% | 4.7% |
Similar Demographics by Unemployment Among Youth under 25 years
Demographics Similar to Immigrants from St. Vincent and the Grenadines by Unemployment Among Youth under 25 years
In terms of unemployment among youth under 25 years, the demographic groups most similar to Immigrants from St. Vincent and the Grenadines are Pima (16.2%, a difference of 0.64%), Arapaho (16.3%, a difference of 0.80%), Yuman (16.3%, a difference of 1.1%), Immigrants from Guyana (15.9%, a difference of 1.3%), and Guyanese (15.9%, a difference of 1.6%).
| Demographics | Rating | Rank | Unemployment Among Youth under 25 years |
| Immigrants | Dominican Republic | 0.0 /100 | #328 | Tragic 15.6% |
| Immigrants | Yemen | 0.0 /100 | #329 | Tragic 15.6% |
| Yakama | 0.0 /100 | #330 | Tragic 15.6% |
| Dominicans | 0.0 /100 | #331 | Tragic 15.7% |
| Immigrants | Grenada | 0.0 /100 | #332 | Tragic 15.8% |
| Guyanese | 0.0 /100 | #333 | Tragic 15.9% |
| Immigrants | Guyana | 0.0 /100 | #334 | Tragic 15.9% |
| Immigrants | St. Vincent and the Grenadines | 0.0 /100 | #335 | Tragic 16.1% |
| Pima | 0.0 /100 | #336 | Tragic 16.2% |
| Arapaho | 0.0 /100 | #337 | Tragic 16.3% |
| Yuman | 0.0 /100 | #338 | Tragic 16.3% |
| Tsimshian | 0.0 /100 | #339 | Tragic 16.5% |
| Colville | 0.0 /100 | #340 | Tragic 16.8% |
| Paiute | 0.0 /100 | #341 | Tragic 17.6% |
| Puerto Ricans | 0.0 /100 | #342 | Tragic 18.4% |
Demographics Similar to Immigrants from Bosnia and Herzegovina by Unemployment Among Youth under 25 years
In terms of unemployment among youth under 25 years, the demographic groups most similar to Immigrants from Bosnia and Herzegovina are Belgian (10.6%, a difference of 0.060%), Pennsylvania German (10.6%, a difference of 0.070%), Finnish (10.7%, a difference of 0.24%), Immigrants from North Macedonia (10.7%, a difference of 0.24%), and Dutch (10.6%, a difference of 0.28%).
| Demographics | Rating | Rank | Unemployment Among Youth under 25 years |
| Venezuelans | 100.0 /100 | #16 | Exceptional 10.6% |
| Menominee | 100.0 /100 | #17 | Exceptional 10.6% |
| Swiss | 100.0 /100 | #18 | Exceptional 10.6% |
| Immigrants | Burma/Myanmar | 100.0 /100 | #19 | Exceptional 10.6% |
| Dutch | 100.0 /100 | #20 | Exceptional 10.6% |
| Pennsylvania Germans | 100.0 /100 | #21 | Exceptional 10.6% |
| Belgians | 100.0 /100 | #22 | Exceptional 10.6% |
| Immigrants | Bosnia and Herzegovina | 100.0 /100 | #23 | Exceptional 10.6% |
| Finns | 100.0 /100 | #24 | Exceptional 10.7% |
| Immigrants | North Macedonia | 100.0 /100 | #25 | Exceptional 10.7% |
| Immigrants | India | 100.0 /100 | #26 | Exceptional 10.7% |
| Yugoslavians | 100.0 /100 | #27 | Exceptional 10.7% |
| Somalis | 100.0 /100 | #28 | Exceptional 10.7% |
| Chinese | 99.9 /100 | #29 | Exceptional 10.7% |
| Osage | 99.9 /100 | #30 | Exceptional 10.7% |