Immigrants from Argentina vs Immigrants from Ghana Unemployment Among Youth under 25 years
COMPARE
Immigrants from Argentina
Immigrants from Ghana
Unemployment Among Youth under 25 years
Unemployment Among Youth under 25 years Comparison
Immigrants from Argentina
Immigrants from Ghana
11.4%
UNEMPLOYMENT AMONG YOUTH UNDER 25 YEARS
87.2/ 100
METRIC RATING
125th/ 347
METRIC RANK
13.4%
UNEMPLOYMENT AMONG YOUTH UNDER 25 YEARS
0.0/ 100
METRIC RATING
289th/ 347
METRIC RANK
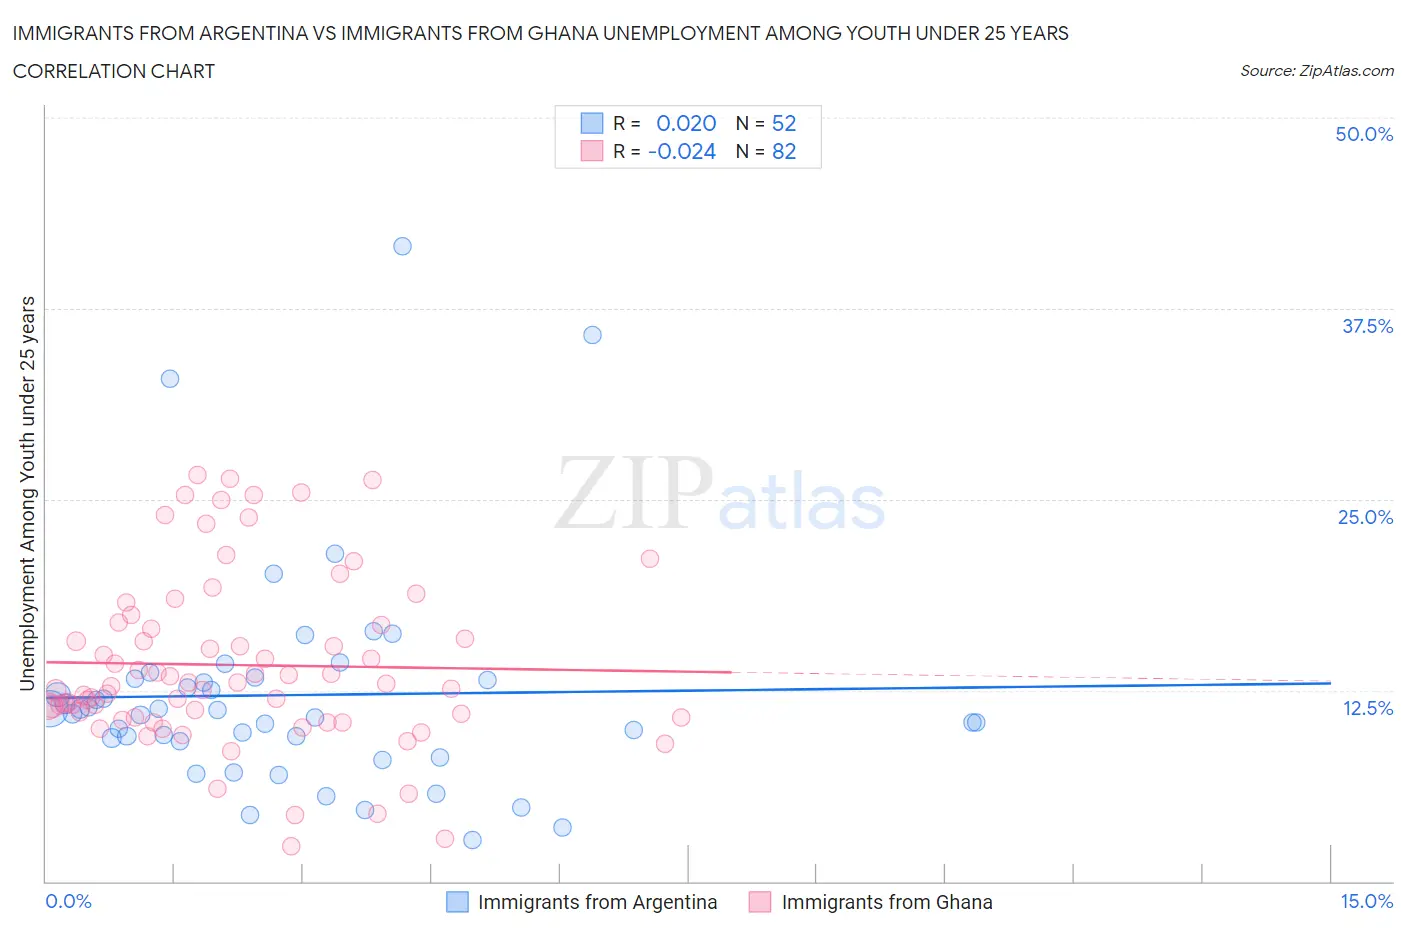
Immigrants from Argentina vs Immigrants from Ghana Unemployment Among Youth under 25 years Correlation Chart
The statistical analysis conducted on geographies consisting of 262,817,431 people shows no correlation between the proportion of Immigrants from Argentina and unemployment rate among youth under the age of 25 in the United States with a correlation coefficient (R) of 0.020 and weighted average of 11.4%. Similarly, the statistical analysis conducted on geographies consisting of 199,301,284 people shows no correlation between the proportion of Immigrants from Ghana and unemployment rate among youth under the age of 25 in the United States with a correlation coefficient (R) of -0.024 and weighted average of 13.4%, a difference of 17.6%.
Unemployment Among Youth under 25 years Correlation Summary
| Measurement | Immigrants from Argentina | Immigrants from Ghana |
| Minimum | 2.7% | 2.3% |
| Maximum | 41.6% | 26.6% |
| Range | 38.9% | 24.3% |
| Mean | 12.2% | 14.2% |
| Median | 11.1% | 12.9% |
| Interquartile 25% (IQ1) | 9.3% | 10.7% |
| Interquartile 75% (IQ3) | 13.2% | 16.8% |
| Interquartile Range (IQR) | 4.0% | 6.1% |
| Standard Deviation (Sample) | 7.2% | 5.6% |
| Standard Deviation (Population) | 7.2% | 5.5% |
Similar Demographics by Unemployment Among Youth under 25 years
Demographics Similar to Immigrants from Argentina by Unemployment Among Youth under 25 years
In terms of unemployment among youth under 25 years, the demographic groups most similar to Immigrants from Argentina are Italian (11.4%, a difference of 0.0%), Canadian (11.4%, a difference of 0.050%), Basque (11.4%, a difference of 0.070%), Immigrants from Micronesia (11.4%, a difference of 0.090%), and Greek (11.4%, a difference of 0.090%).
| Demographics | Rating | Rank | Unemployment Among Youth under 25 years |
| Afghans | 89.7 /100 | #118 | Excellent 11.3% |
| Immigrants | Scotland | 89.2 /100 | #119 | Excellent 11.4% |
| Malaysians | 89.0 /100 | #120 | Excellent 11.4% |
| Slovaks | 88.9 /100 | #121 | Excellent 11.4% |
| Immigrants | Micronesia | 88.1 /100 | #122 | Excellent 11.4% |
| Basques | 87.8 /100 | #123 | Excellent 11.4% |
| Italians | 87.2 /100 | #124 | Excellent 11.4% |
| Immigrants | Argentina | 87.2 /100 | #125 | Excellent 11.4% |
| Canadians | 86.6 /100 | #126 | Excellent 11.4% |
| Greeks | 86.2 /100 | #127 | Excellent 11.4% |
| Immigrants | Hungary | 86.0 /100 | #128 | Excellent 11.4% |
| Turks | 85.8 /100 | #129 | Excellent 11.4% |
| Hungarians | 85.7 /100 | #130 | Excellent 11.4% |
| Immigrants | Spain | 84.6 /100 | #131 | Excellent 11.4% |
| Ethiopians | 83.2 /100 | #132 | Excellent 11.4% |
Demographics Similar to Immigrants from Ghana by Unemployment Among Youth under 25 years
In terms of unemployment among youth under 25 years, the demographic groups most similar to Immigrants from Ghana are Immigrants from Western Africa (13.4%, a difference of 0.11%), Immigrants from Ecuador (13.4%, a difference of 0.34%), Ecuadorian (13.3%, a difference of 0.54%), Blackfeet (13.3%, a difference of 0.55%), and Ghanaian (13.3%, a difference of 0.60%).
| Demographics | Rating | Rank | Unemployment Among Youth under 25 years |
| Sierra Leoneans | 0.0 /100 | #282 | Tragic 13.3% |
| Immigrants | Cameroon | 0.0 /100 | #283 | Tragic 13.3% |
| Lumbee | 0.0 /100 | #284 | Tragic 13.3% |
| Ghanaians | 0.0 /100 | #285 | Tragic 13.3% |
| Blackfeet | 0.0 /100 | #286 | Tragic 13.3% |
| Ecuadorians | 0.0 /100 | #287 | Tragic 13.3% |
| Immigrants | Western Africa | 0.0 /100 | #288 | Tragic 13.4% |
| Immigrants | Ghana | 0.0 /100 | #289 | Tragic 13.4% |
| Immigrants | Ecuador | 0.0 /100 | #290 | Tragic 13.4% |
| Apache | 0.0 /100 | #291 | Tragic 13.5% |
| Central American Indians | 0.0 /100 | #292 | Tragic 13.5% |
| Spanish American Indians | 0.0 /100 | #293 | Tragic 13.5% |
| Immigrants | Caribbean | 0.0 /100 | #294 | Tragic 13.5% |
| Chippewa | 0.0 /100 | #295 | Tragic 13.5% |
| Senegalese | 0.0 /100 | #296 | Tragic 13.5% |