Immigrants from Kenya vs Immigrants from Ghana Unemployment Among Youth under 25 years
COMPARE
Immigrants from Kenya
Immigrants from Ghana
Unemployment Among Youth under 25 years
Unemployment Among Youth under 25 years Comparison
Immigrants from Kenya
Immigrants from Ghana
11.2%
UNEMPLOYMENT AMONG YOUTH UNDER 25 YEARS
97.6/ 100
METRIC RATING
68th/ 347
METRIC RANK
13.4%
UNEMPLOYMENT AMONG YOUTH UNDER 25 YEARS
0.0/ 100
METRIC RATING
289th/ 347
METRIC RANK
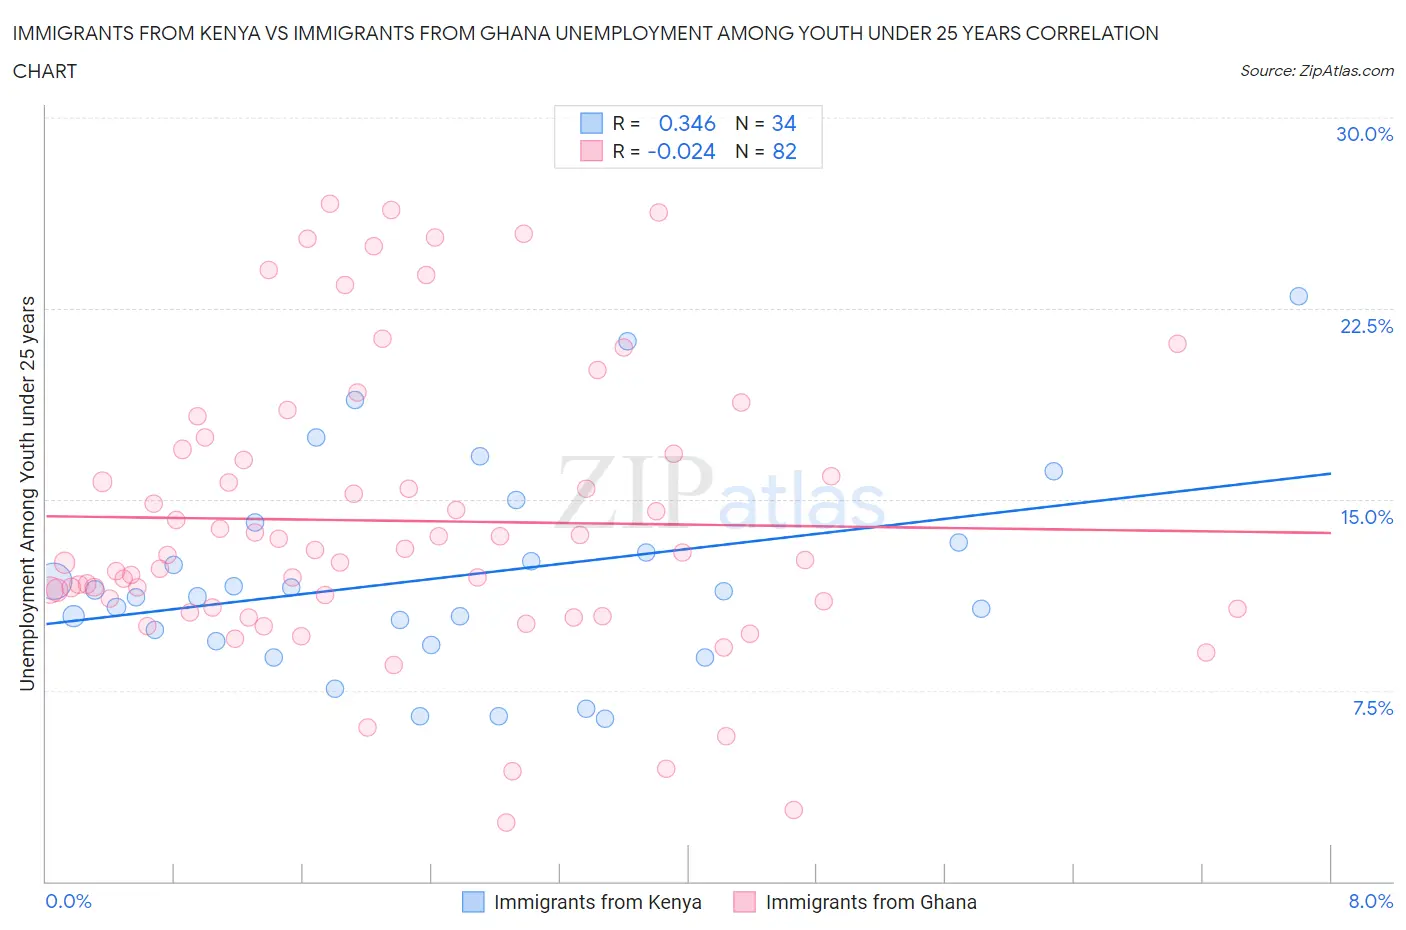
Immigrants from Kenya vs Immigrants from Ghana Unemployment Among Youth under 25 years Correlation Chart
The statistical analysis conducted on geographies consisting of 217,150,374 people shows a mild positive correlation between the proportion of Immigrants from Kenya and unemployment rate among youth under the age of 25 in the United States with a correlation coefficient (R) of 0.346 and weighted average of 11.2%. Similarly, the statistical analysis conducted on geographies consisting of 199,301,284 people shows no correlation between the proportion of Immigrants from Ghana and unemployment rate among youth under the age of 25 in the United States with a correlation coefficient (R) of -0.024 and weighted average of 13.4%, a difference of 19.9%.
Unemployment Among Youth under 25 years Correlation Summary
| Measurement | Immigrants from Kenya | Immigrants from Ghana |
| Minimum | 6.4% | 2.3% |
| Maximum | 23.0% | 26.6% |
| Range | 16.6% | 24.3% |
| Mean | 11.9% | 14.2% |
| Median | 11.3% | 12.9% |
| Interquartile 25% (IQ1) | 9.4% | 10.7% |
| Interquartile 75% (IQ3) | 13.3% | 16.8% |
| Interquartile Range (IQR) | 3.9% | 6.1% |
| Standard Deviation (Sample) | 4.0% | 5.6% |
| Standard Deviation (Population) | 3.9% | 5.5% |
Similar Demographics by Unemployment Among Youth under 25 years
Demographics Similar to Immigrants from Kenya by Unemployment Among Youth under 25 years
In terms of unemployment among youth under 25 years, the demographic groups most similar to Immigrants from Kenya are Chickasaw (11.2%, a difference of 0.020%), Macedonian (11.2%, a difference of 0.040%), Immigrants from Moldova (11.2%, a difference of 0.050%), Slavic (11.2%, a difference of 0.050%), and Immigrants from Singapore (11.2%, a difference of 0.070%).
| Demographics | Rating | Rank | Unemployment Among Youth under 25 years |
| Filipinos | 98.3 /100 | #61 | Exceptional 11.1% |
| Immigrants | Netherlands | 98.1 /100 | #62 | Exceptional 11.1% |
| Immigrants | Croatia | 98.1 /100 | #63 | Exceptional 11.1% |
| Jordanians | 97.9 /100 | #64 | Exceptional 11.1% |
| Immigrants | Singapore | 97.8 /100 | #65 | Exceptional 11.2% |
| Macedonians | 97.7 /100 | #66 | Exceptional 11.2% |
| Chickasaw | 97.7 /100 | #67 | Exceptional 11.2% |
| Immigrants | Kenya | 97.6 /100 | #68 | Exceptional 11.2% |
| Immigrants | Moldova | 97.5 /100 | #69 | Exceptional 11.2% |
| Slavs | 97.5 /100 | #70 | Exceptional 11.2% |
| Bhutanese | 97.4 /100 | #71 | Exceptional 11.2% |
| Immigrants | Australia | 97.3 /100 | #72 | Exceptional 11.2% |
| Creek | 97.2 /100 | #73 | Exceptional 11.2% |
| New Zealanders | 97.2 /100 | #74 | Exceptional 11.2% |
| French | 97.1 /100 | #75 | Exceptional 11.2% |
Demographics Similar to Immigrants from Ghana by Unemployment Among Youth under 25 years
In terms of unemployment among youth under 25 years, the demographic groups most similar to Immigrants from Ghana are Immigrants from Western Africa (13.4%, a difference of 0.11%), Immigrants from Ecuador (13.4%, a difference of 0.34%), Ecuadorian (13.3%, a difference of 0.54%), Blackfeet (13.3%, a difference of 0.55%), and Ghanaian (13.3%, a difference of 0.60%).
| Demographics | Rating | Rank | Unemployment Among Youth under 25 years |
| Sierra Leoneans | 0.0 /100 | #282 | Tragic 13.3% |
| Immigrants | Cameroon | 0.0 /100 | #283 | Tragic 13.3% |
| Lumbee | 0.0 /100 | #284 | Tragic 13.3% |
| Ghanaians | 0.0 /100 | #285 | Tragic 13.3% |
| Blackfeet | 0.0 /100 | #286 | Tragic 13.3% |
| Ecuadorians | 0.0 /100 | #287 | Tragic 13.3% |
| Immigrants | Western Africa | 0.0 /100 | #288 | Tragic 13.4% |
| Immigrants | Ghana | 0.0 /100 | #289 | Tragic 13.4% |
| Immigrants | Ecuador | 0.0 /100 | #290 | Tragic 13.4% |
| Apache | 0.0 /100 | #291 | Tragic 13.5% |
| Central American Indians | 0.0 /100 | #292 | Tragic 13.5% |
| Spanish American Indians | 0.0 /100 | #293 | Tragic 13.5% |
| Immigrants | Caribbean | 0.0 /100 | #294 | Tragic 13.5% |
| Chippewa | 0.0 /100 | #295 | Tragic 13.5% |
| Senegalese | 0.0 /100 | #296 | Tragic 13.5% |