Luxembourger vs Immigrants from Bosnia and Herzegovina Unemployment Among Youth under 25 years
COMPARE
Luxembourger
Immigrants from Bosnia and Herzegovina
Unemployment Among Youth under 25 years
Unemployment Among Youth under 25 years Comparison
Luxembourgers
Immigrants from Bosnia and Herzegovina
10.0%
UNEMPLOYMENT AMONG YOUTH UNDER 25 YEARS
100.0/ 100
METRIC RATING
3rd/ 347
METRIC RANK
10.6%
UNEMPLOYMENT AMONG YOUTH UNDER 25 YEARS
100.0/ 100
METRIC RATING
23rd/ 347
METRIC RANK
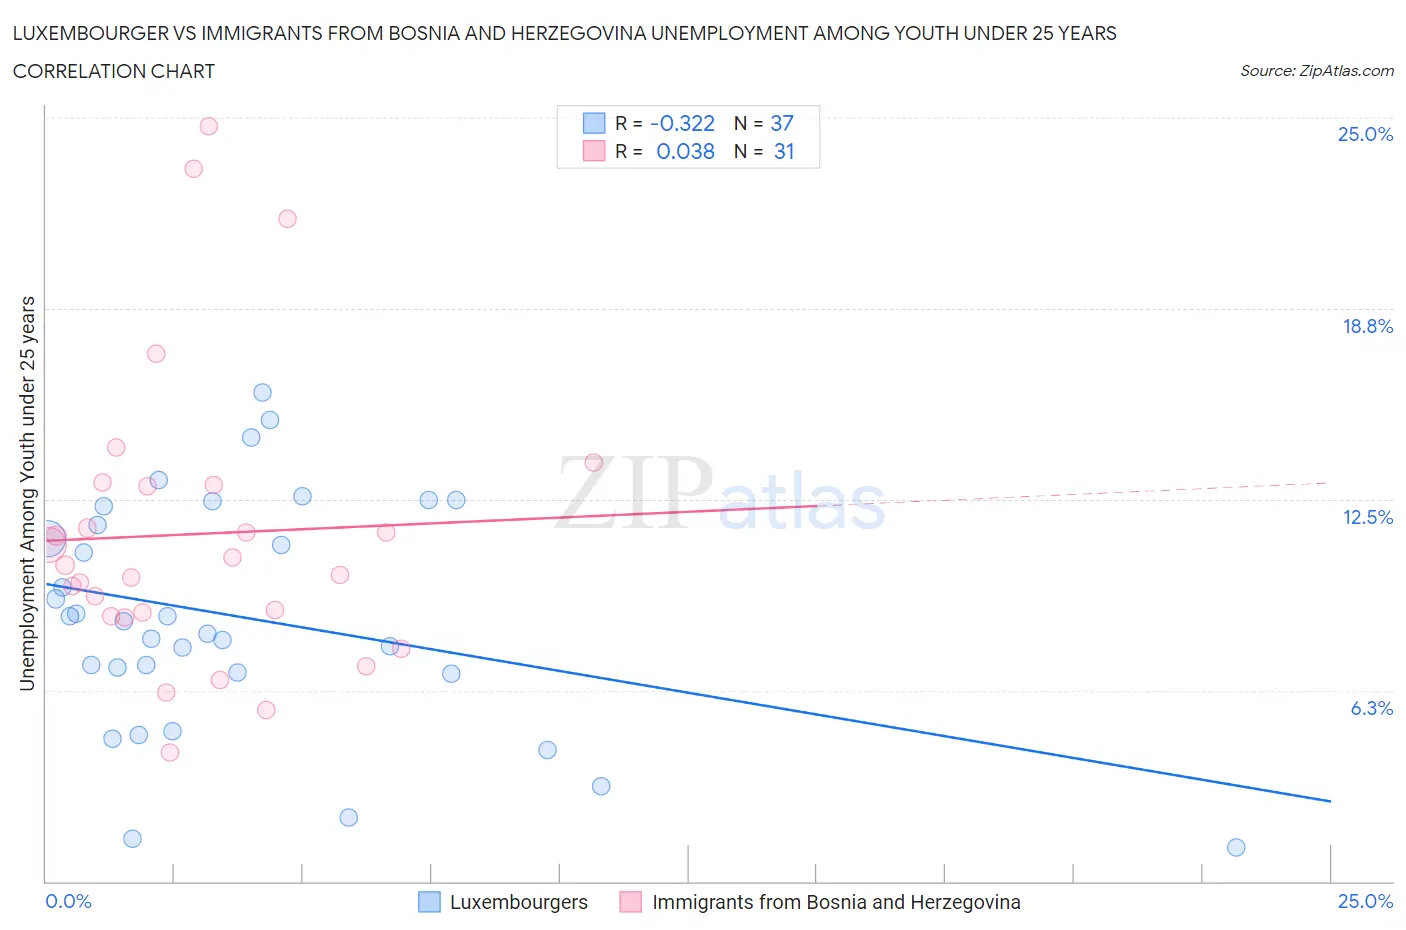
Luxembourger vs Immigrants from Bosnia and Herzegovina Unemployment Among Youth under 25 years Correlation Chart
The statistical analysis conducted on geographies consisting of 143,473,980 people shows a mild negative correlation between the proportion of Luxembourgers and unemployment rate among youth under the age of 25 in the United States with a correlation coefficient (R) of -0.322 and weighted average of 10.0%. Similarly, the statistical analysis conducted on geographies consisting of 156,028,830 people shows no correlation between the proportion of Immigrants from Bosnia and Herzegovina and unemployment rate among youth under the age of 25 in the United States with a correlation coefficient (R) of 0.038 and weighted average of 10.6%, a difference of 6.0%.
Unemployment Among Youth under 25 years Correlation Summary
| Measurement | Luxembourger | Immigrants from Bosnia and Herzegovina |
| Minimum | 1.1% | 4.2% |
| Maximum | 16.0% | 24.7% |
| Range | 14.9% | 20.5% |
| Mean | 8.6% | 11.4% |
| Median | 8.5% | 10.3% |
| Interquartile 25% (IQ1) | 6.8% | 8.7% |
| Interquartile 75% (IQ3) | 12.0% | 13.0% |
| Interquartile Range (IQR) | 5.1% | 4.3% |
| Standard Deviation (Sample) | 3.8% | 4.8% |
| Standard Deviation (Population) | 3.7% | 4.7% |
Demographics Similar to Luxembourgers and Immigrants from Bosnia and Herzegovina by Unemployment Among Youth under 25 years
In terms of unemployment among youth under 25 years, the demographic groups most similar to Luxembourgers are Zimbabwean (10.2%, a difference of 1.6%), Czech (10.3%, a difference of 2.7%), Danish (10.3%, a difference of 2.9%), Swedish (10.4%, a difference of 3.6%), and Immigrants from Venezuela (10.5%, a difference of 4.5%). Similarly, the demographic groups most similar to Immigrants from Bosnia and Herzegovina are Belgian (10.6%, a difference of 0.060%), Pennsylvania German (10.6%, a difference of 0.070%), Dutch (10.6%, a difference of 0.28%), Immigrants from Burma/Myanmar (10.6%, a difference of 0.30%), and Swiss (10.6%, a difference of 0.32%).
| Demographics | Rating | Rank | Unemployment Among Youth under 25 years |
| Luxembourgers | 100.0 /100 | #3 | Exceptional 10.0% |
| Zimbabweans | 100.0 /100 | #4 | Exceptional 10.2% |
| Czechs | 100.0 /100 | #5 | Exceptional 10.3% |
| Danes | 100.0 /100 | #6 | Exceptional 10.3% |
| Swedes | 100.0 /100 | #7 | Exceptional 10.4% |
| Immigrants | Venezuela | 100.0 /100 | #8 | Exceptional 10.5% |
| Germans | 100.0 /100 | #9 | Exceptional 10.5% |
| Immigrants | Somalia | 100.0 /100 | #10 | Exceptional 10.5% |
| Scandinavians | 100.0 /100 | #11 | Exceptional 10.5% |
| Immigrants | Sudan | 100.0 /100 | #12 | Exceptional 10.5% |
| Indonesians | 100.0 /100 | #13 | Exceptional 10.6% |
| Cubans | 100.0 /100 | #14 | Exceptional 10.6% |
| Sudanese | 100.0 /100 | #15 | Exceptional 10.6% |
| Venezuelans | 100.0 /100 | #16 | Exceptional 10.6% |
| Menominee | 100.0 /100 | #17 | Exceptional 10.6% |
| Swiss | 100.0 /100 | #18 | Exceptional 10.6% |
| Immigrants | Burma/Myanmar | 100.0 /100 | #19 | Exceptional 10.6% |
| Dutch | 100.0 /100 | #20 | Exceptional 10.6% |
| Pennsylvania Germans | 100.0 /100 | #21 | Exceptional 10.6% |
| Belgians | 100.0 /100 | #22 | Exceptional 10.6% |
| Immigrants | Bosnia and Herzegovina | 100.0 /100 | #23 | Exceptional 10.6% |