Immigrants from Burma/Myanmar vs Guamanian/Chamorro Unemployment Among Ages 35 to 44 years
COMPARE
Immigrants from Burma/Myanmar
Guamanian/Chamorro
Unemployment Among Ages 35 to 44 years
Unemployment Among Ages 35 to 44 years Comparison
Immigrants from Burma/Myanmar
Guamanians/Chamorros
4.6%
UNEMPLOYMENT AMONG AGES 35 TO 44 YEARS
72.2/ 100
METRIC RATING
149th/ 347
METRIC RANK
5.1%
UNEMPLOYMENT AMONG AGES 35 TO 44 YEARS
0.9/ 100
METRIC RATING
235th/ 347
METRIC RANK
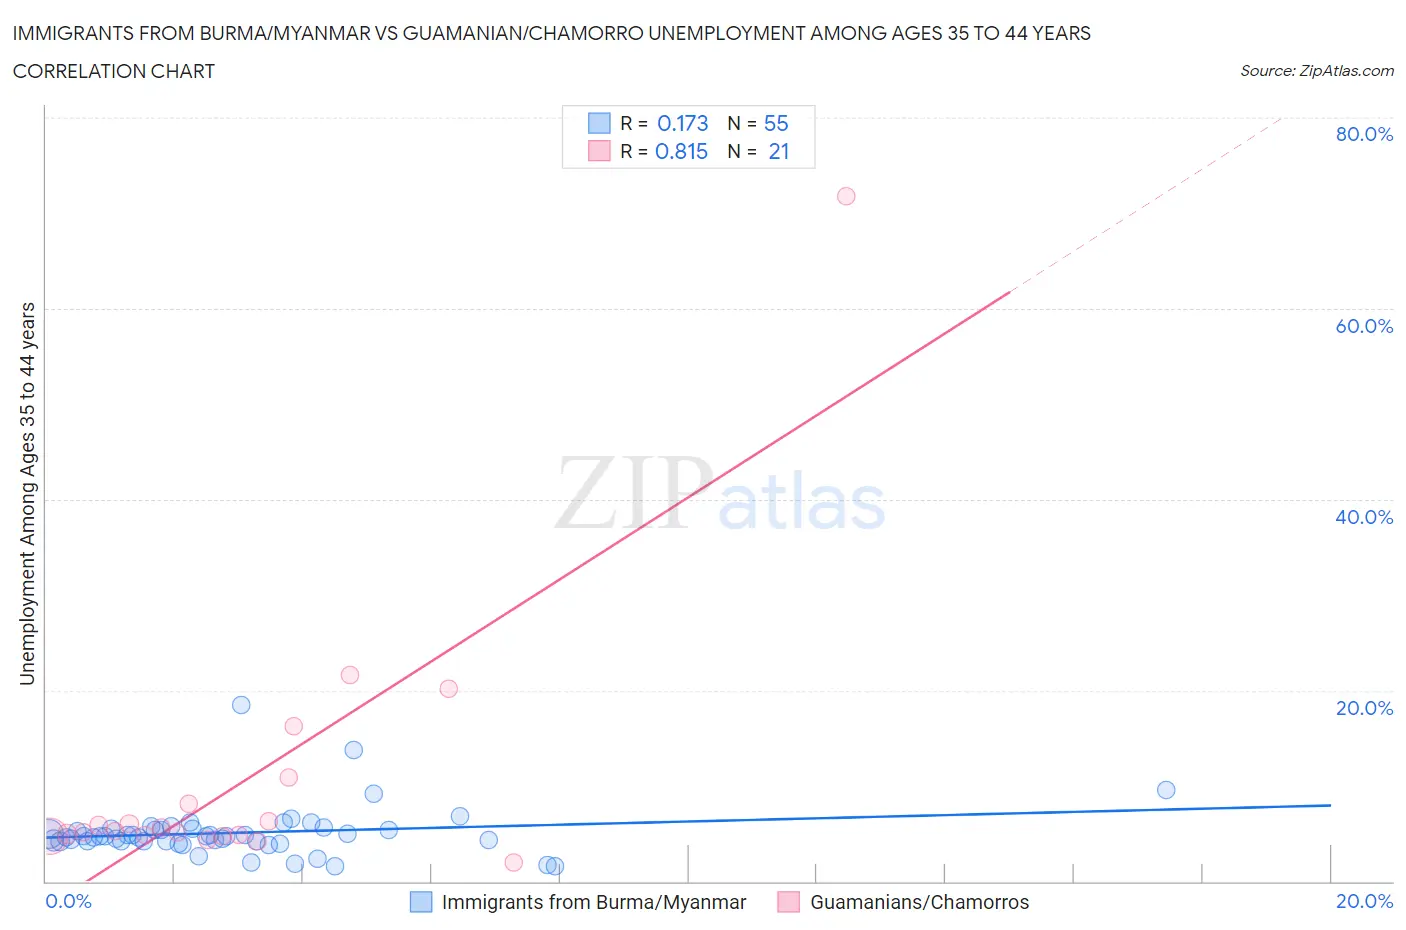
Immigrants from Burma/Myanmar vs Guamanian/Chamorro Unemployment Among Ages 35 to 44 years Correlation Chart
The statistical analysis conducted on geographies consisting of 171,415,766 people shows a poor positive correlation between the proportion of Immigrants from Burma/Myanmar and unemployment rate among population between the ages 35 and 44 in the United States with a correlation coefficient (R) of 0.173 and weighted average of 4.6%. Similarly, the statistical analysis conducted on geographies consisting of 219,585,271 people shows a very strong positive correlation between the proportion of Guamanians/Chamorros and unemployment rate among population between the ages 35 and 44 in the United States with a correlation coefficient (R) of 0.815 and weighted average of 5.1%, a difference of 10.1%.
Unemployment Among Ages 35 to 44 years Correlation Summary
| Measurement | Immigrants from Burma/Myanmar | Guamanian/Chamorro |
| Minimum | 1.6% | 1.9% |
| Maximum | 18.5% | 71.7% |
| Range | 16.9% | 69.8% |
| Mean | 5.1% | 10.6% |
| Median | 4.7% | 5.2% |
| Interquartile 25% (IQ1) | 4.2% | 4.8% |
| Interquartile 75% (IQ3) | 5.5% | 9.5% |
| Interquartile Range (IQR) | 1.3% | 4.7% |
| Standard Deviation (Sample) | 2.7% | 15.0% |
| Standard Deviation (Population) | 2.7% | 14.6% |
Similar Demographics by Unemployment Among Ages 35 to 44 years
Demographics Similar to Immigrants from Burma/Myanmar by Unemployment Among Ages 35 to 44 years
In terms of unemployment among ages 35 to 44 years, the demographic groups most similar to Immigrants from Burma/Myanmar are Slavic (4.6%, a difference of 0.020%), Immigrants from Vietnam (4.6%, a difference of 0.14%), Immigrants from England (4.6%, a difference of 0.15%), Immigrants from Denmark (4.6%, a difference of 0.20%), and Immigrants from Eastern Europe (4.6%, a difference of 0.23%).
| Demographics | Rating | Rank | Unemployment Among Ages 35 to 44 years |
| Ukrainians | 75.8 /100 | #142 | Good 4.6% |
| Immigrants | Switzerland | 75.5 /100 | #143 | Good 4.6% |
| Immigrants | Russia | 75.4 /100 | #144 | Good 4.6% |
| Immigrants | Eastern Europe | 74.7 /100 | #145 | Good 4.6% |
| Immigrants | Denmark | 74.4 /100 | #146 | Good 4.6% |
| Immigrants | Vietnam | 73.8 /100 | #147 | Good 4.6% |
| Slavs | 72.4 /100 | #148 | Good 4.6% |
| Immigrants | Burma/Myanmar | 72.2 /100 | #149 | Good 4.6% |
| Immigrants | England | 70.5 /100 | #150 | Good 4.6% |
| Puget Sound Salish | 67.1 /100 | #151 | Good 4.6% |
| Pakistanis | 67.1 /100 | #152 | Good 4.6% |
| Immigrants | Brazil | 67.0 /100 | #153 | Good 4.6% |
| Immigrants | Western Europe | 65.5 /100 | #154 | Good 4.6% |
| Whites/Caucasians | 64.9 /100 | #155 | Good 4.6% |
| South Americans | 63.7 /100 | #156 | Good 4.6% |
Demographics Similar to Guamanians/Chamorros by Unemployment Among Ages 35 to 44 years
In terms of unemployment among ages 35 to 44 years, the demographic groups most similar to Guamanians/Chamorros are Central American (5.1%, a difference of 0.21%), Portuguese (5.1%, a difference of 0.26%), Kiowa (5.1%, a difference of 0.26%), Immigrants from Nigeria (5.1%, a difference of 0.33%), and Iroquois (5.1%, a difference of 0.38%).
| Demographics | Rating | Rank | Unemployment Among Ages 35 to 44 years |
| Samoans | 1.8 /100 | #228 | Tragic 5.0% |
| Immigrants | Cambodia | 1.5 /100 | #229 | Tragic 5.0% |
| Liberians | 1.3 /100 | #230 | Tragic 5.1% |
| Japanese | 1.2 /100 | #231 | Tragic 5.1% |
| Iroquois | 1.2 /100 | #232 | Tragic 5.1% |
| Immigrants | Nigeria | 1.2 /100 | #233 | Tragic 5.1% |
| Portuguese | 1.1 /100 | #234 | Tragic 5.1% |
| Guamanians/Chamorros | 0.9 /100 | #235 | Tragic 5.1% |
| Central Americans | 0.8 /100 | #236 | Tragic 5.1% |
| Kiowa | 0.8 /100 | #237 | Tragic 5.1% |
| Hondurans | 0.7 /100 | #238 | Tragic 5.1% |
| Nigerians | 0.7 /100 | #239 | Tragic 5.1% |
| Somalis | 0.7 /100 | #240 | Tragic 5.1% |
| Immigrants | Honduras | 0.6 /100 | #241 | Tragic 5.1% |
| Delaware | 0.5 /100 | #242 | Tragic 5.1% |