Immigrants from Sri Lanka vs Immigrants from Iraq Unemployment Among Youth under 25 years
COMPARE
Immigrants from Sri Lanka
Immigrants from Iraq
Unemployment Among Youth under 25 years
Unemployment Among Youth under 25 years Comparison
Immigrants from Sri Lanka
Immigrants from Iraq
11.7%
UNEMPLOYMENT AMONG YOUTH UNDER 25 YEARS
27.8/ 100
METRIC RATING
194th/ 347
METRIC RANK
11.6%
UNEMPLOYMENT AMONG YOUTH UNDER 25 YEARS
47.0/ 100
METRIC RATING
175th/ 347
METRIC RANK
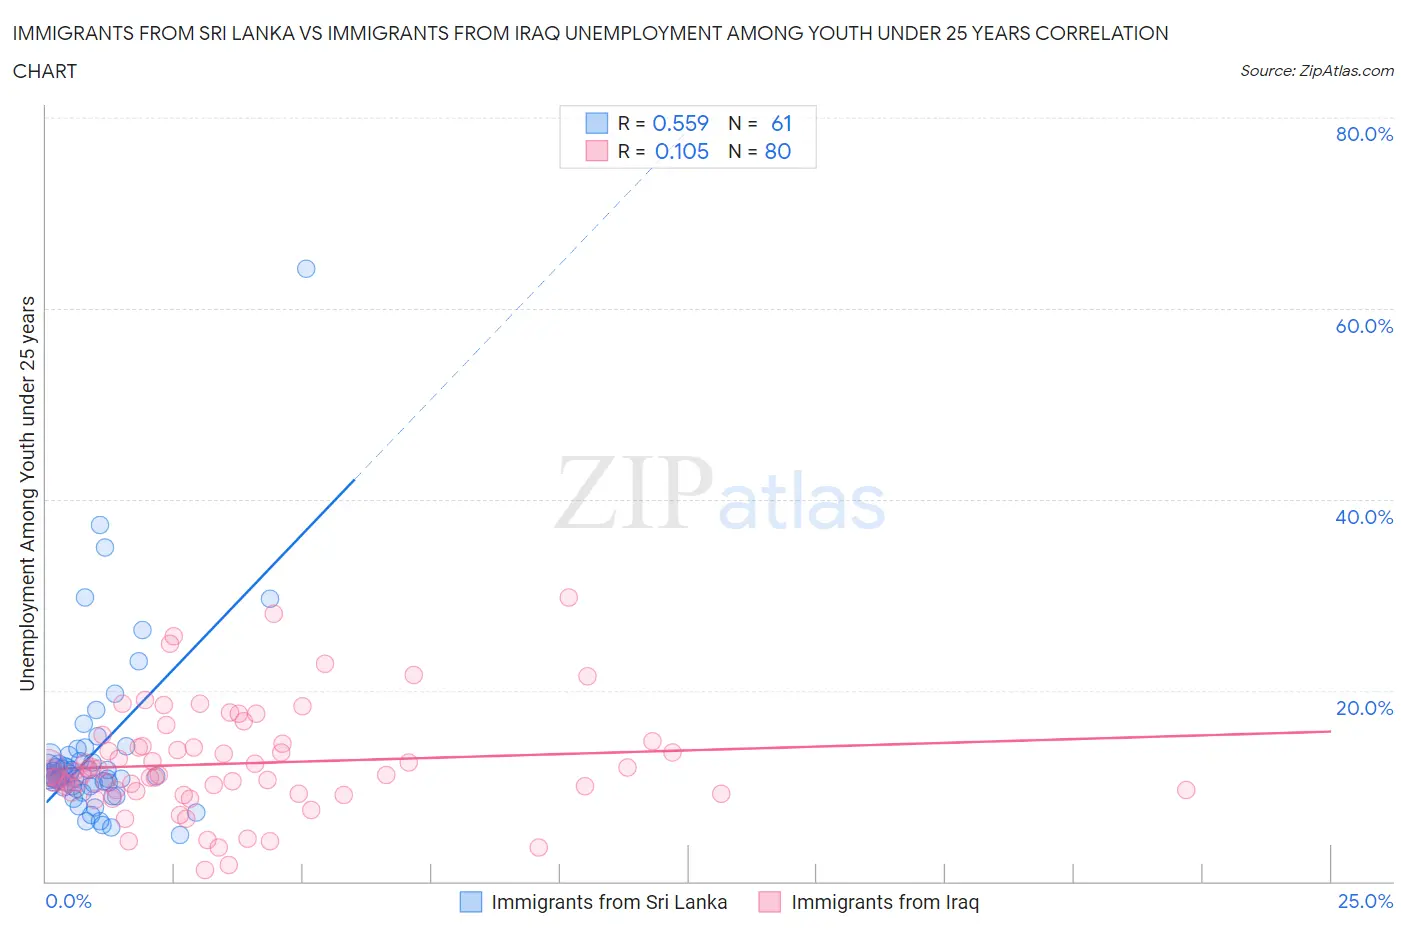
Immigrants from Sri Lanka vs Immigrants from Iraq Unemployment Among Youth under 25 years Correlation Chart
The statistical analysis conducted on geographies consisting of 149,393,171 people shows a substantial positive correlation between the proportion of Immigrants from Sri Lanka and unemployment rate among youth under the age of 25 in the United States with a correlation coefficient (R) of 0.559 and weighted average of 11.7%. Similarly, the statistical analysis conducted on geographies consisting of 194,003,673 people shows a poor positive correlation between the proportion of Immigrants from Iraq and unemployment rate among youth under the age of 25 in the United States with a correlation coefficient (R) of 0.105 and weighted average of 11.6%, a difference of 0.86%.
Unemployment Among Youth under 25 years Correlation Summary
| Measurement | Immigrants from Sri Lanka | Immigrants from Iraq |
| Minimum | 4.9% | 1.2% |
| Maximum | 64.1% | 29.7% |
| Range | 59.2% | 28.5% |
| Mean | 13.6% | 12.3% |
| Median | 11.0% | 11.3% |
| Interquartile 25% (IQ1) | 9.9% | 9.4% |
| Interquartile 75% (IQ3) | 13.2% | 14.2% |
| Interquartile Range (IQR) | 3.3% | 4.9% |
| Standard Deviation (Sample) | 9.3% | 5.6% |
| Standard Deviation (Population) | 9.2% | 5.5% |
Demographics Similar to Immigrants from Sri Lanka and Immigrants from Iraq by Unemployment Among Youth under 25 years
In terms of unemployment among youth under 25 years, the demographic groups most similar to Immigrants from Sri Lanka are Seminole (11.7%, a difference of 0.010%), Immigrants from Russia (11.7%, a difference of 0.030%), Cypriot (11.7%, a difference of 0.040%), Portuguese (11.7%, a difference of 0.13%), and Japanese (11.7%, a difference of 0.15%). Similarly, the demographic groups most similar to Immigrants from Iraq are Ugandan (11.6%, a difference of 0.060%), Immigrants from Denmark (11.6%, a difference of 0.090%), Immigrants from China (11.6%, a difference of 0.12%), Immigrants from Europe (11.6%, a difference of 0.19%), and Immigrants from Hong Kong (11.6%, a difference of 0.19%).
| Demographics | Rating | Rank | Unemployment Among Youth under 25 years |
| Immigrants | China | 50.0 /100 | #174 | Average 11.6% |
| Immigrants | Iraq | 47.0 /100 | #175 | Average 11.6% |
| Ugandans | 45.6 /100 | #176 | Average 11.6% |
| Immigrants | Denmark | 45.0 /100 | #177 | Average 11.6% |
| Immigrants | Europe | 42.4 /100 | #178 | Average 11.6% |
| Immigrants | Hong Kong | 42.4 /100 | #179 | Average 11.6% |
| Spaniards | 39.8 /100 | #180 | Fair 11.7% |
| Syrians | 38.4 /100 | #181 | Fair 11.7% |
| Immigrants | Italy | 36.2 /100 | #182 | Fair 11.7% |
| Americans | 34.5 /100 | #183 | Fair 11.7% |
| Immigrants | Eastern Europe | 34.1 /100 | #184 | Fair 11.7% |
| French American Indians | 34.0 /100 | #185 | Fair 11.7% |
| Maltese | 33.9 /100 | #186 | Fair 11.7% |
| Immigrants | Egypt | 31.9 /100 | #187 | Fair 11.7% |
| Immigrants | Poland | 31.4 /100 | #188 | Fair 11.7% |
| Japanese | 30.8 /100 | #189 | Fair 11.7% |
| Portuguese | 30.3 /100 | #190 | Fair 11.7% |
| Cypriots | 28.5 /100 | #191 | Fair 11.7% |
| Immigrants | Russia | 28.5 /100 | #192 | Fair 11.7% |
| Seminole | 27.9 /100 | #193 | Fair 11.7% |
| Immigrants | Sri Lanka | 27.8 /100 | #194 | Fair 11.7% |