Immigrants from Sri Lanka vs Immigrants from Iraq 8th Grade
COMPARE
Immigrants from Sri Lanka
Immigrants from Iraq
8th Grade
8th Grade Comparison
Immigrants from Sri Lanka
Immigrants from Iraq
95.8%
8TH GRADE
64.1/ 100
METRIC RATING
163rd/ 347
METRIC RANK
95.6%
8TH GRADE
36.2/ 100
METRIC RATING
183rd/ 347
METRIC RANK
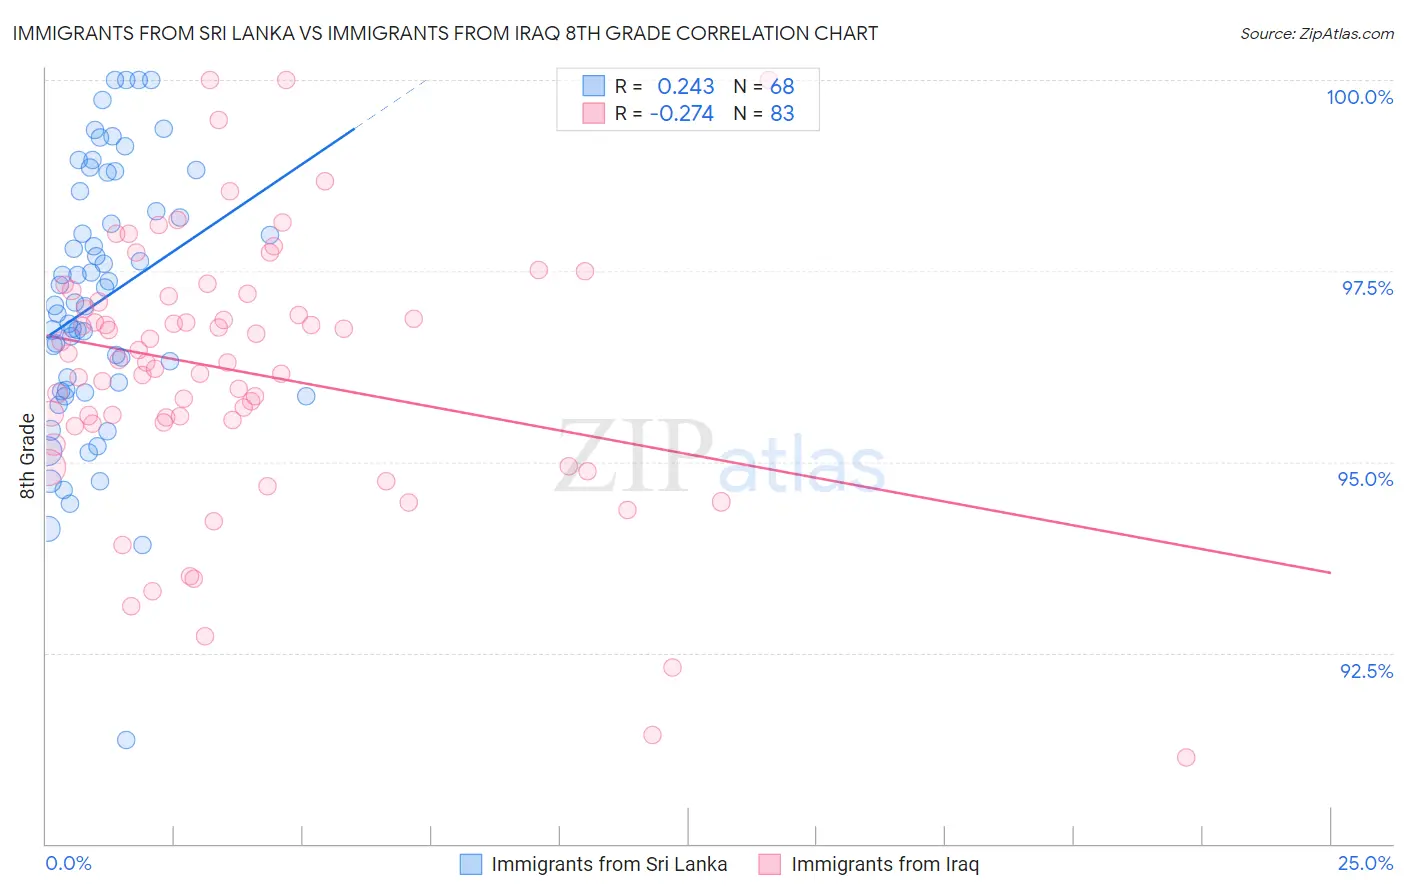
Immigrants from Sri Lanka vs Immigrants from Iraq 8th Grade Correlation Chart
The statistical analysis conducted on geographies consisting of 149,660,761 people shows a weak positive correlation between the proportion of Immigrants from Sri Lanka and percentage of population with at least 8th grade education in the United States with a correlation coefficient (R) of 0.243 and weighted average of 95.8%. Similarly, the statistical analysis conducted on geographies consisting of 194,632,332 people shows a weak negative correlation between the proportion of Immigrants from Iraq and percentage of population with at least 8th grade education in the United States with a correlation coefficient (R) of -0.274 and weighted average of 95.6%, a difference of 0.19%.
8th Grade Correlation Summary
| Measurement | Immigrants from Sri Lanka | Immigrants from Iraq |
| Minimum | 91.4% | 91.1% |
| Maximum | 100.0% | 100.0% |
| Range | 8.6% | 8.9% |
| Mean | 97.1% | 96.2% |
| Median | 97.1% | 96.3% |
| Interquartile 25% (IQ1) | 95.9% | 95.5% |
| Interquartile 75% (IQ3) | 98.4% | 97.2% |
| Interquartile Range (IQR) | 2.5% | 1.7% |
| Standard Deviation (Sample) | 1.7% | 1.7% |
| Standard Deviation (Population) | 1.7% | 1.7% |
Demographics Similar to Immigrants from Sri Lanka and Immigrants from Iraq by 8th Grade
In terms of 8th grade, the demographic groups most similar to Immigrants from Sri Lanka are Immigrants from Italy (95.8%, a difference of 0.0%), Alsatian (95.8%, a difference of 0.020%), Immigrants from Poland (95.8%, a difference of 0.020%), Spaniard (95.8%, a difference of 0.030%), and Immigrants from Ukraine (95.8%, a difference of 0.030%). Similarly, the demographic groups most similar to Immigrants from Iraq are Immigrants from Egypt (95.7%, a difference of 0.010%), Immigrants from Spain (95.7%, a difference of 0.020%), Iraqi (95.7%, a difference of 0.030%), Immigrants from Brazil (95.7%, a difference of 0.060%), and Pakistani (95.7%, a difference of 0.080%).
| Demographics | Rating | Rank | 8th Grade |
| Immigrants | Sri Lanka | 64.1 /100 | #163 | Good 95.8% |
| Immigrants | Italy | 63.5 /100 | #164 | Good 95.8% |
| Alsatians | 61.4 /100 | #165 | Good 95.8% |
| Immigrants | Poland | 61.1 /100 | #166 | Good 95.8% |
| Spaniards | 60.0 /100 | #167 | Good 95.8% |
| Immigrants | Ukraine | 59.5 /100 | #168 | Average 95.8% |
| Immigrants | Iran | 58.6 /100 | #169 | Average 95.8% |
| Ute | 58.5 /100 | #170 | Average 95.8% |
| Egyptians | 58.2 /100 | #171 | Average 95.8% |
| Immigrants | Korea | 57.9 /100 | #172 | Average 95.8% |
| Mongolians | 53.0 /100 | #173 | Average 95.8% |
| Chileans | 50.0 /100 | #174 | Average 95.7% |
| Immigrants | Albania | 49.6 /100 | #175 | Average 95.7% |
| Pakistanis | 48.8 /100 | #176 | Average 95.7% |
| Marshallese | 47.6 /100 | #177 | Average 95.7% |
| Venezuelans | 47.5 /100 | #178 | Average 95.7% |
| Immigrants | Brazil | 45.4 /100 | #179 | Average 95.7% |
| Iraqis | 40.5 /100 | #180 | Average 95.7% |
| Immigrants | Spain | 38.7 /100 | #181 | Fair 95.7% |
| Immigrants | Egypt | 37.9 /100 | #182 | Fair 95.7% |
| Immigrants | Iraq | 36.2 /100 | #183 | Fair 95.6% |